59
Graphing Chapter 4
kk
kk
k Trace
With trace, you can move a flashing pointer along a graph with the f, c, d, and
e cursor keys and obtain readouts of coordinates at each point. The following
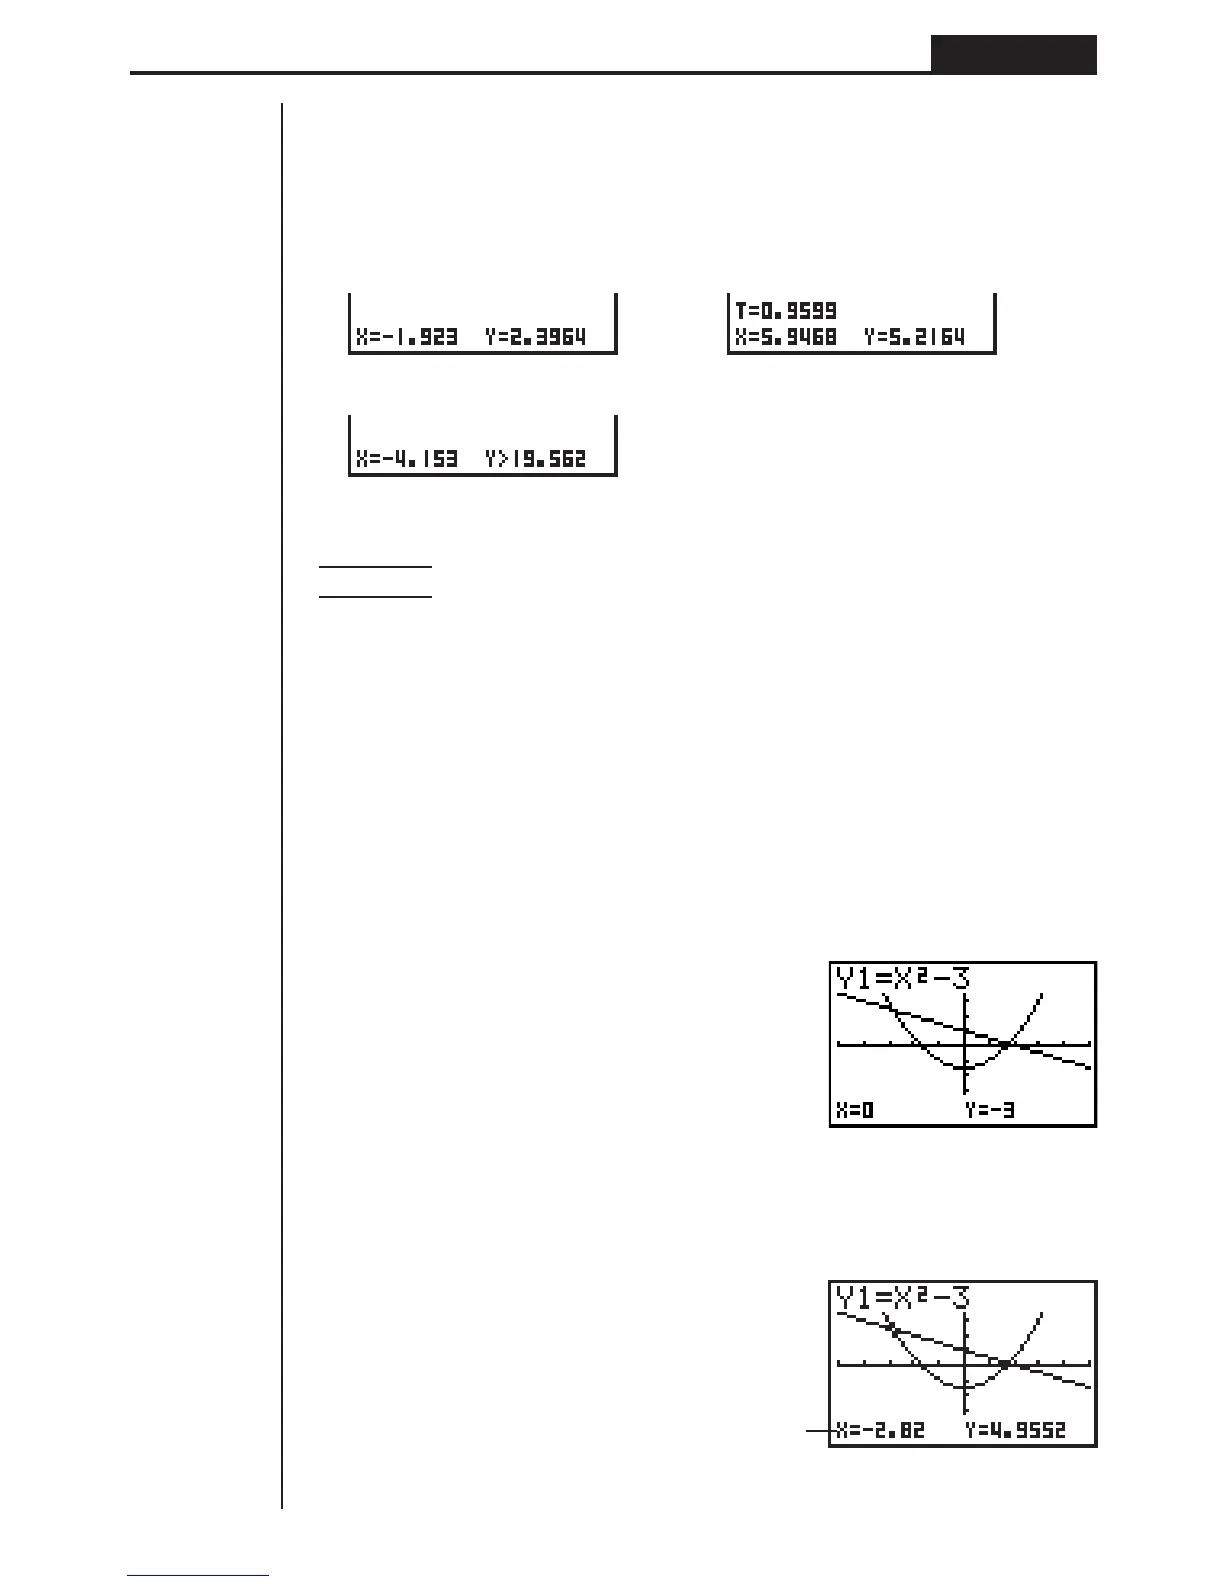
shows the different types of coordinate readouts produced by trace.
•Rectangular Coordinate Graph • Parametric Function Graph
•Inequality Graph
uu
uu
uTo use trace to read coordinates
Example To determine the points of intersection for graphs produced by
the following functions:
Y1:
y = x
2
– 3
Y2:
y = –x + 2
Use the following View Window parameters.
Xmin = –5 Ymin = –10
Xmax = 5 Ymax = 10
Xscl = 1 Yscl = 2
1. After drawing the graphs, press 1 (TRCE) to display the pointer in the center of
the graph.
1(TRCE)
• The pointer may not be visible on the graph when you press 1 (TRCE).
2. Use d to move the pointer to the first intersection.
d
~ d
x/y
coordinate values