180
Program for
t-Test Value
Description
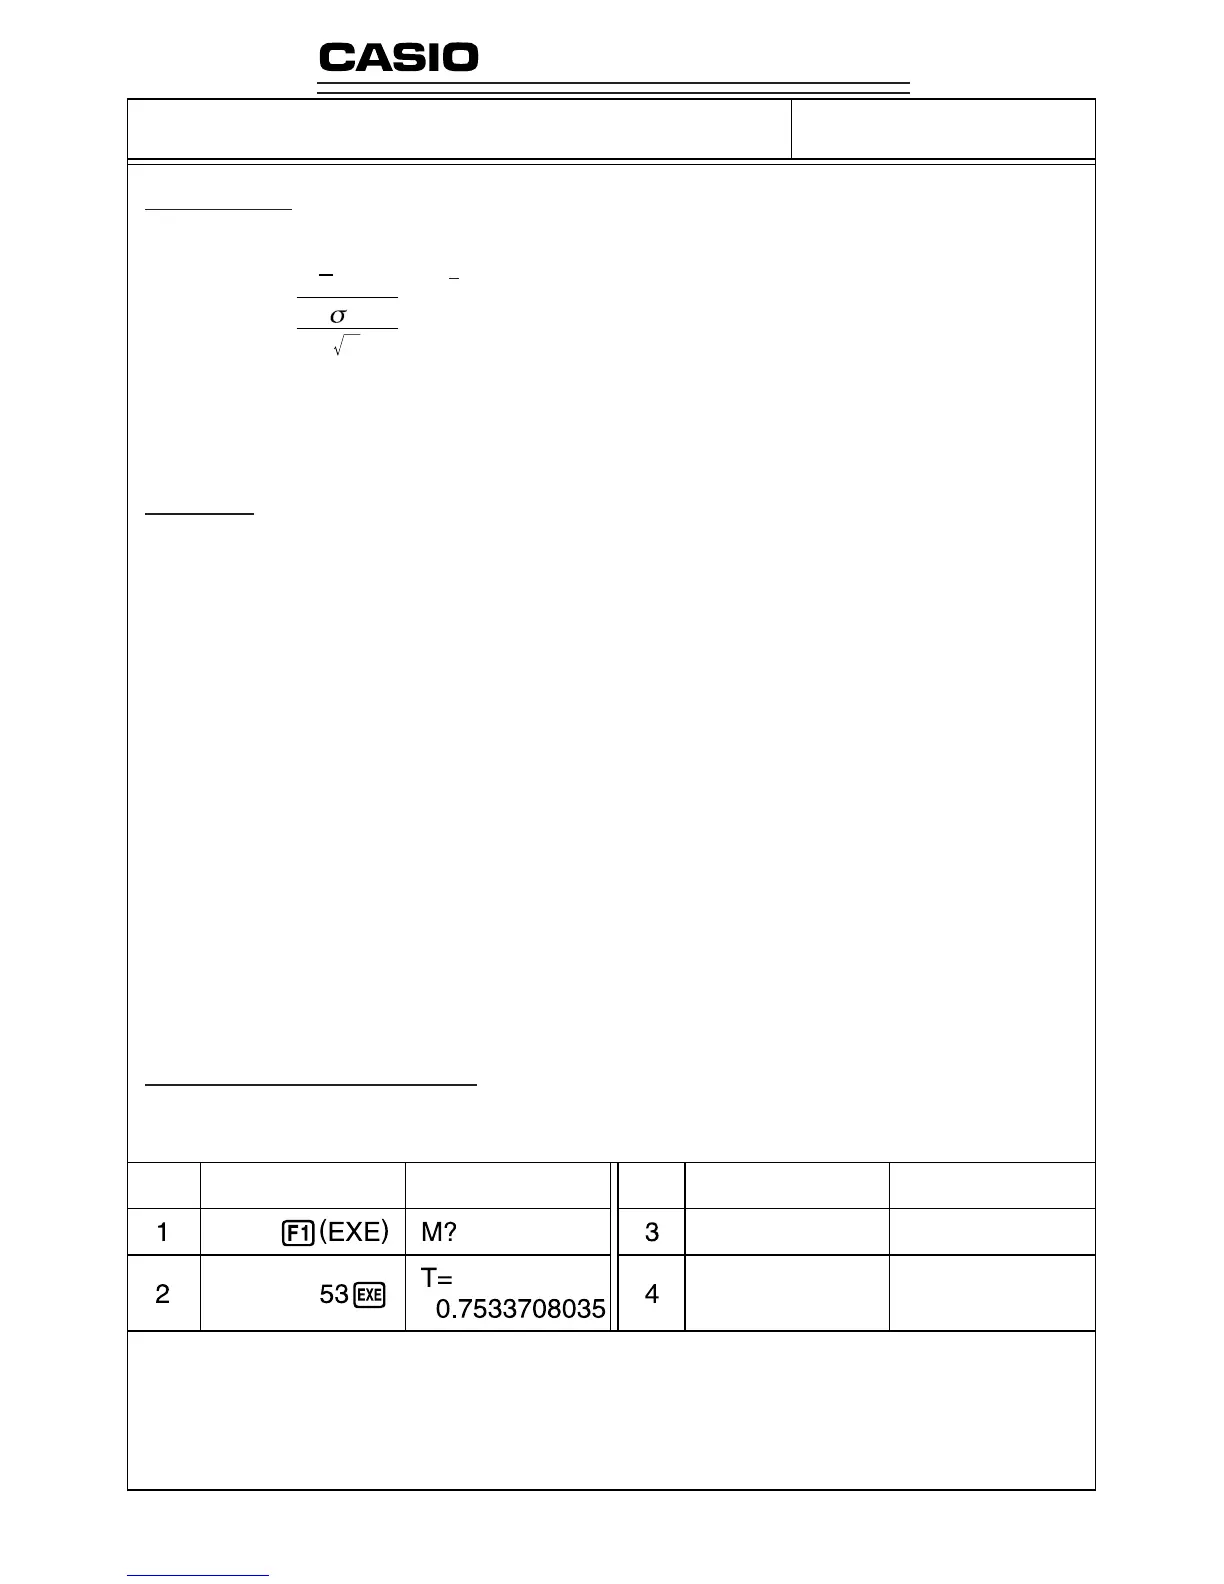
The mean (sample mean) and sample standard deviation can be used to obtain a t-test value.
x : mean of x data
xσn–1 : sample standard deviation of x data
n : number of data items
m : hypothetical population standard deviation (normally repre-
sented by
µ
, but m is used here because of variable name
limitations)
Example To determine whether the population standard deviation for sample data 55, 54, 51,
55, 53, 53, 54, 52, is 53.
Perform a
t-test with a level of significance of 5%.
Preparation and operation
•Store the program written on the next page.
•Execute the program as shown below.
PROGRAM SHEET
No.
3
Step Key operation Display Step Key operation Display
The above operation produces a t-test value of t(53) = 0.7533708035. According to the t-distribution
table in the next page, a level of significance of 5% and a degree of freedom of 7 (
n – 1 = 8 – 1 = 7)
produce a two-sided
t-test value of approximately 2.365. Since the calculated t-test value is lower
than the table value, the hypothesis that population mean
m equals 53 is accepted.
t =
(x – m)
x n–1
n