109
Statistical Graphs and Calculations Chapter 7
The following describes the meaning of each of the parameters.
_
x ...................... Mean of data
Σ
x .................... Sum of data
Σ
x
2
.................. Sum of squares
xσn .................. Population standard deviation
xσn-1 ................ Sample standard deviation
n ...................... Number of data items
minX................ Minimum
Q1 ................... First quartile
Med ................. Median
Q3 ................... Third quartile
maxX............... Maximum
Mod ................. Mode
•Press 4 (DRAW) to return to the original single-variable statistical graph.
kk
kk
k Pie Chart
From the statistical data list, press 1 (GRPH) to display the graph menu, press [
4 (SET), and then change the graph type of the graph you want to use (GPH1,
GPH2, GPH3) to pie chart. Next, move the highlighting to “Display” and then press
1 or 2 to select the pie chart data format.
1 (%) ............ Displayed values show what percentage of the total data each
pie segment represents.
2 (Data) ....... Displayed values show actual data.
Press Q to draw the chart.
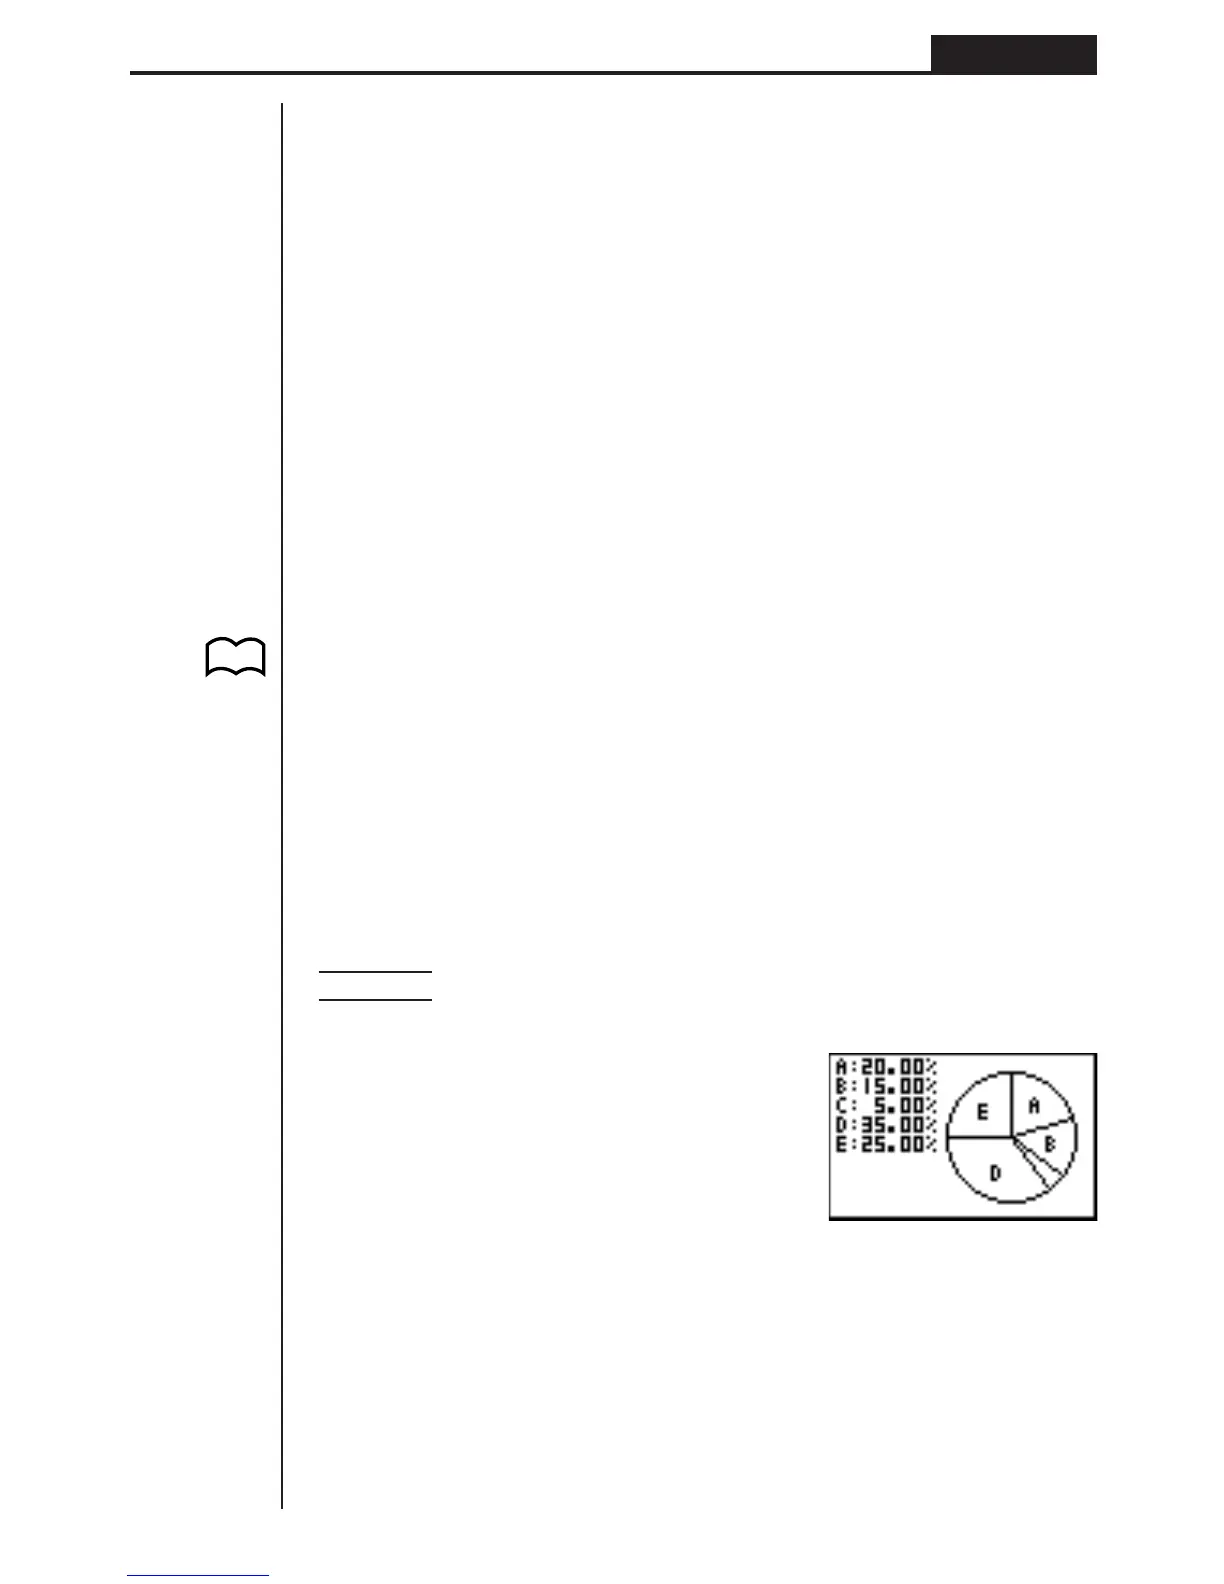
Example To input the following data into List 1 and use it to draw a pie
chart: 18.0, 13.5, 4.5, 31.5, 22.5
1(GRPH)[4(SET)
1(GPH1)c
3(Pie)c
1(List1)c
1(%)Q
1(GRPH)1(GPH1)
•A pie chart can have up to eight data items. Attempting to draw a pie chart for a
list that has more than eight data items causes an error (Dim ERROR).
•Only positive data can be included in a pie chart. Attempting to draw a pie chart
for a list that includes negative data causes an error (Ma ERROR).
•View Window settings are not applied to pie charts.
•A pie chart cannot be superimposed with another graph.
•Values appearing on a pie chart are automatically assigned to the corresponding
variables (A, B, C, etc.)
P. 100
(G-Type)
(Pie)