110
Chapter 7 Statistical Graphs and Calculations
•Performing a trace operation (!1 (TRCE)) while a pie chart is on the display
causes the pointer to appear at the topmost segment. Pressing e and d moves
the pointer to neighboring segments.
•While a pie graph is on the display, you can toggle between the two data formats
(percent and data) by pressing !4 (CHNG).
•You cannot draw multiple pie charts on the same screen.
•Percent values shown on pie charts are cut off to two decimal places.
uu
uu
u Performing Mathematical Operations Using Pie Chart Data
Pressing !3 (GSLV) causes the cursor to appear at the bottom of the screen.
You can then perform mathematical operations using the chart’s data.
Example To perform the operation A + B
After drawing the pie chart, perform the following operation.
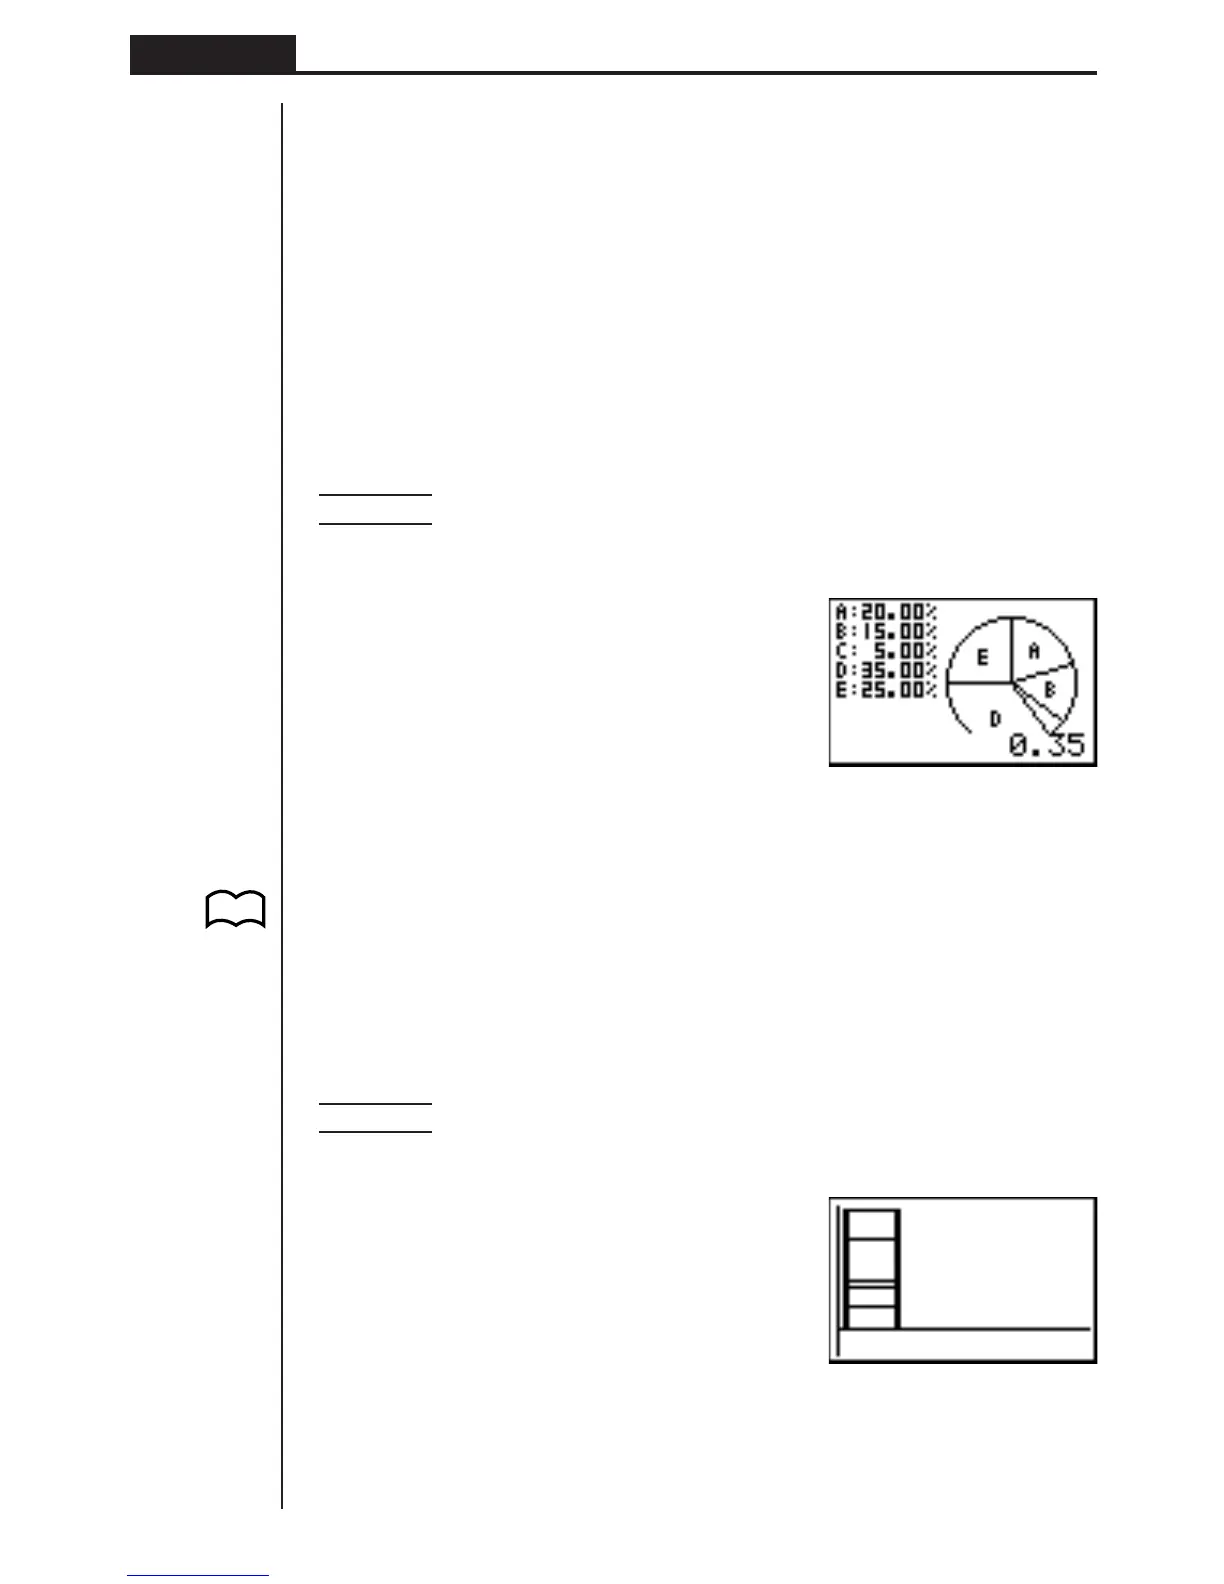
!3(GSLV)
aA+aB
w
The result shows that A and B account for 35% of the data.
kk
kk
k Stacked Bar Chart
From the statistical data list, press 1 (GRPH) to display the graph menu, press [
4 (SET), and then change the graph type of the graph you want to use (GPH1,
GPH2, GPH3) to stacked bar chart.
Press Q to draw the chart.
Example To input the following data into List 1 and use it to draw a stacked
bar chart: 18.0, 13.5, 4.5, 31.5, 22.5
1(GRPH)[4(SET)
1(GPH1)c
4(Stck)c
1(List1)Q
1(GRPH)1(GPH1)
•A stacked bar chart can have up to eight data items. Attempting to draw a stacked
bar chart for a list that has more than eight data items causes an error (Dim
ERROR).
P. 100
(G-Type)
(Stck)