115
Statistical Graphs and Calculations Chapter 7
kk
kk
k Med-Med Graph
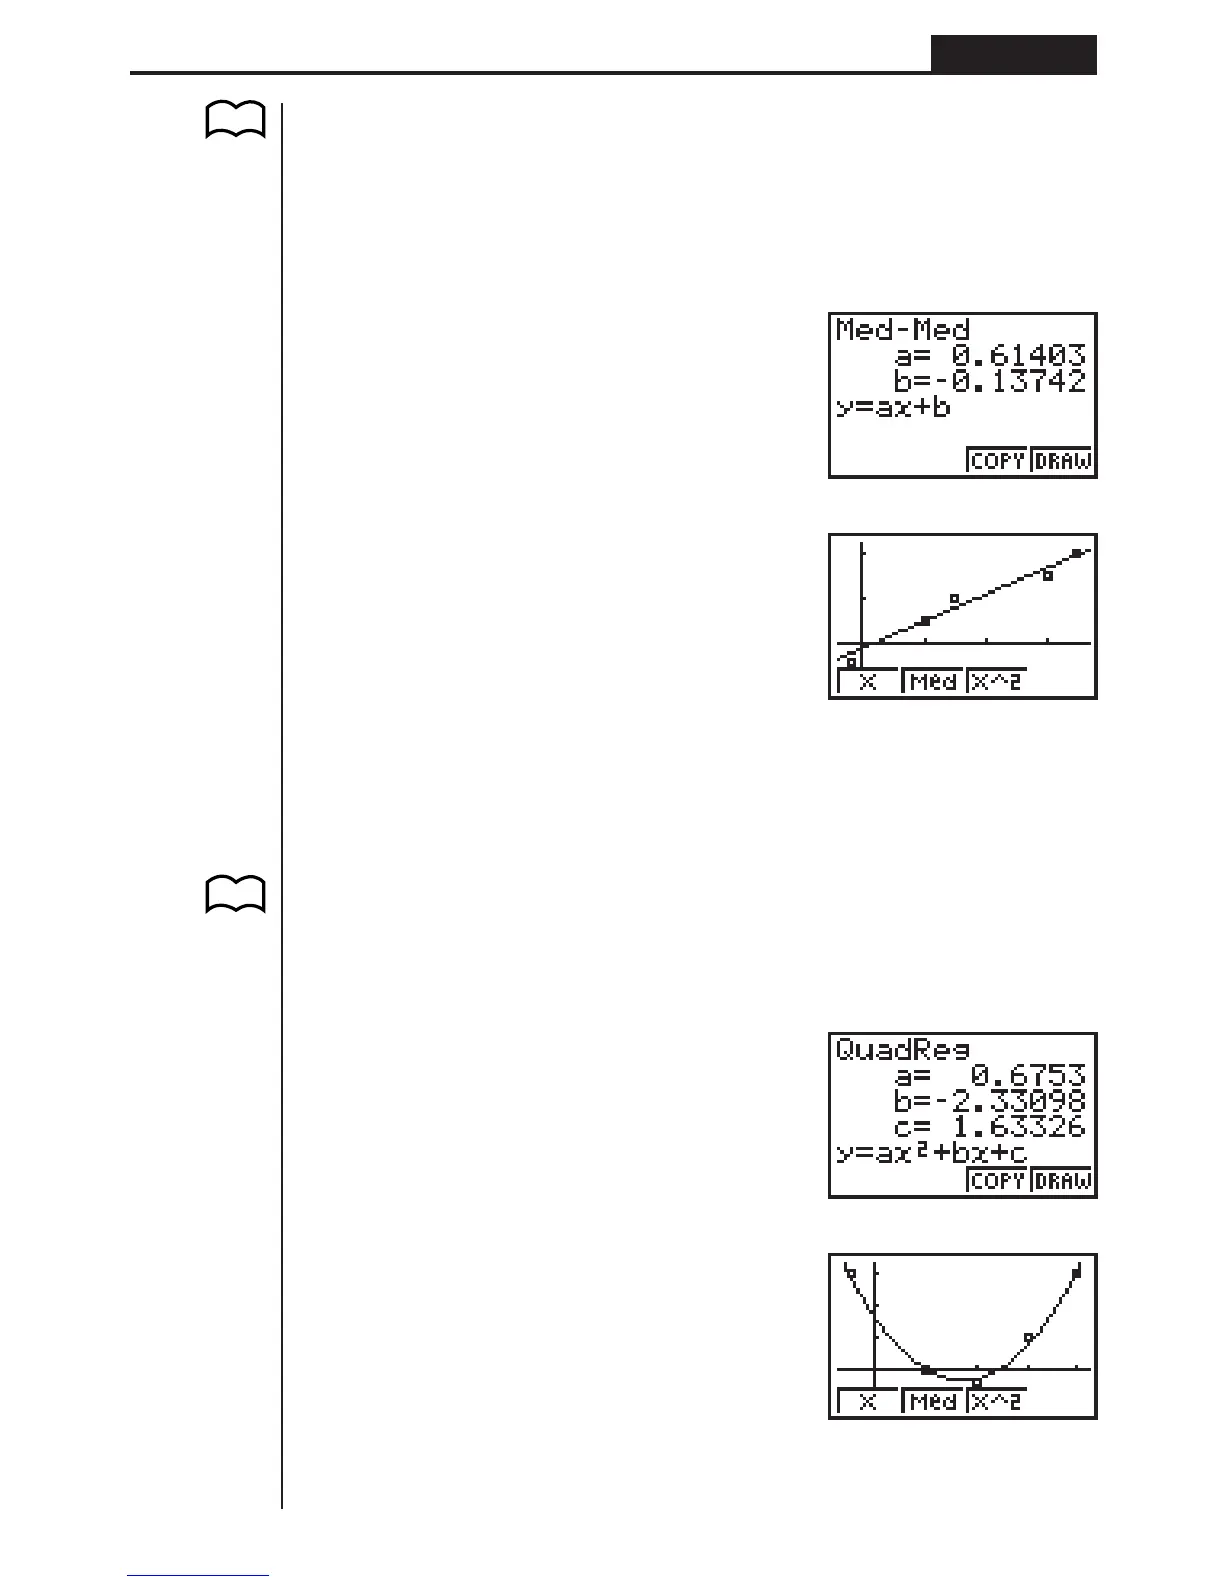
When it is suspected that there are a number of extreme values, a Med-Med graph
can be used in place of the least squares method. This is also a type of linear regres-
sion, but it minimizes the effects of extreme values. It is especially useful in produc-
ing highly reliable linear regression from data that includes irregular fluctuations,
such as seasonal surveys.
2(Med)
4(DRAW)
The following are the meanings of the above parameters.
a ...... Med-Med graph slope
b ...... Med-Med graph y-intercept
kk
kk
k Quadratic Regression Graph
A quadratic regression graph represents connection of the data points of a scatter
diagram. It actually is a scattering of so many points that are close enough together
to be connected. The formula that represents this is quadratic regression.
3(X^2)
4(DRAW)
P. 105
1234
1234
P. 105