99
Statistical Graphs and Calculations Chapter 7
2. Use f and c to move the highlighting to the graph whose draw (On)/non-draw
(Off) status you want to change and press 1 (On) or 2 (Off).
3. To return to the graph menu, press Q.
uu
uu
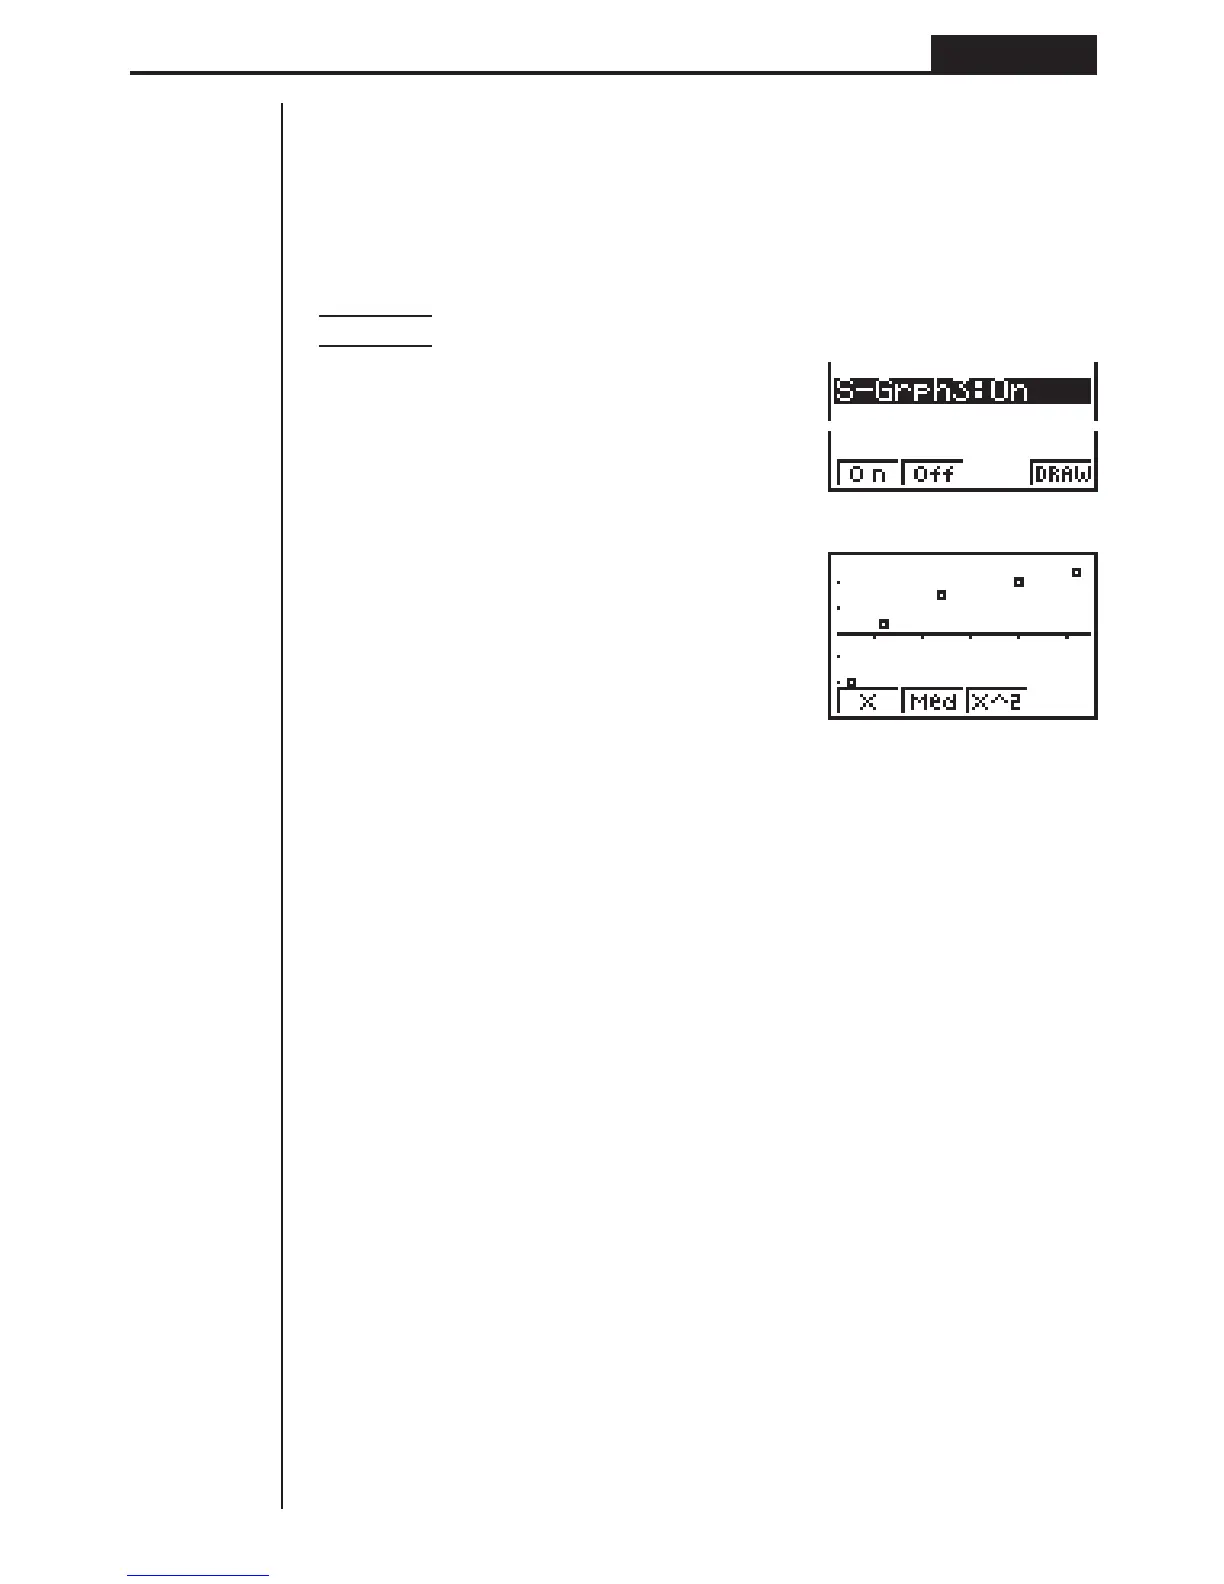
uTo draw a graph
Example To draw a scatter diagram of Graph 3 only
1(GRPH)[1(SEL)
2(Off)
cc1(On)
4(DRAW)
2. General graph settings (SET)
This section describes how to use the general graph settings screen to make the
following settings for each graph (GPH1, GPH2, GPH3).
• Graph Type
The initial default graph type setting for all the graphs is scatter graph. You can select
one of a variety of other statistical graph types for each graph.
• List or Data
The initial default statistical data is List 1 for single-variable data, and List 1 and List
2 for paired-variable data. You can specify which statistical data list you want to use
to draw the graph.
• Frequency
Normally, each data item or data pair in the statistical data list is represented on a
graph as a point. When you are working with a large number of data items however,
this can cause problems because of the number of plot points on the graph. When
this happens, you can specify a frequency list that contains values indicating the
number of instances (the frequency) of the data items in the corresponding cells of
the lists you are using for
x-data and y-data. Once you do this, only one point is
plotted for the multiple data items, which makes the graph easier to read.
• Mark Type
This setting lets you specify the shape of the plot points on the graph.
123 4