119
Statistical Graphs and Calculations Chapter 7
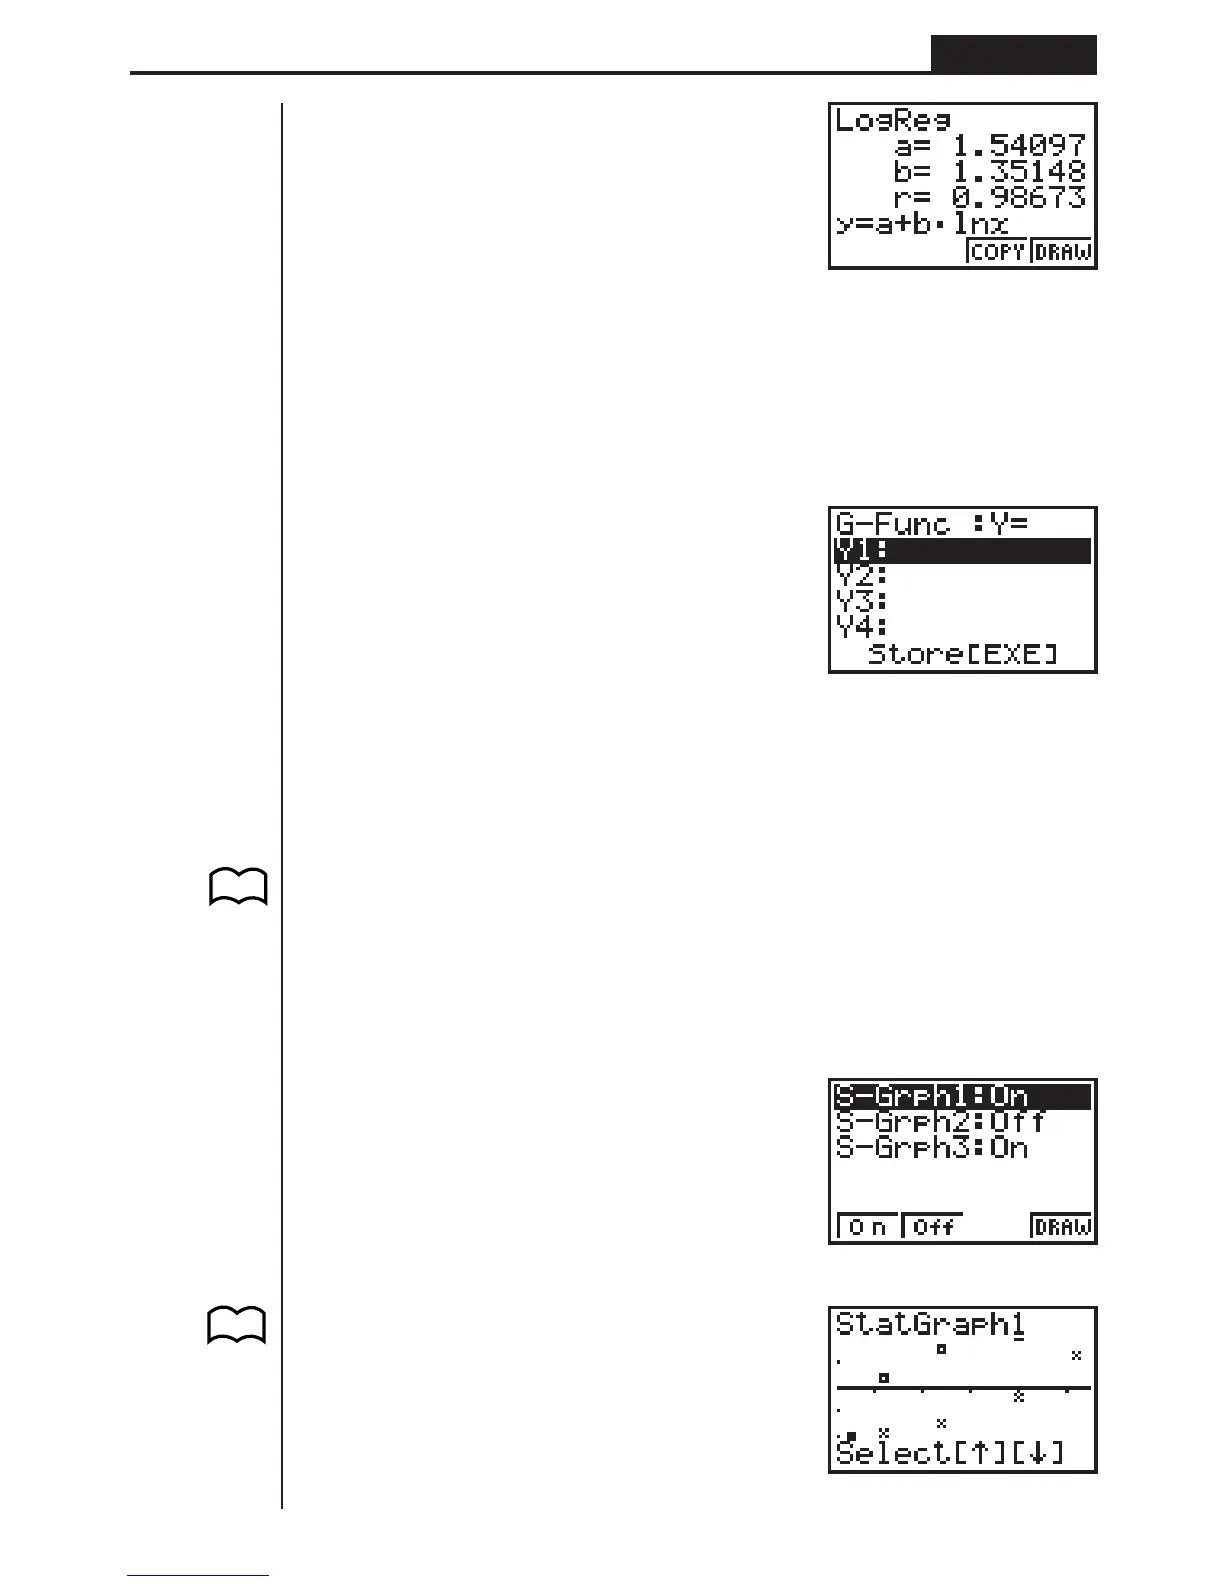
3 (COPY)..... Stores the displayed regression formula to the GRAPH Mode
4 (DRAW) .... Graphs the displayed regression formula
1. Press 3 (COPY) to copy the regression formula that produced the displayed
data to the GRAPH Mode.
3(COPY)
Note that you cannot edit regression formulas for graph formulas in the GRAPH
Mode.
2. Press w to save the copied graph formula and return to the previous regression
calculation result display.
kk
kk
k Multiple Graphs
You can draw more than one graph on the same display by using the procedure
under “Changing Graph Parameters” to set the graph draw (On)/non-draw (Off) sta-
tus of two or all three of the graphs to draw (On), and then pressing 4 (DRAW).
After drawing the graphs, you can select which graph formula to use when perform-
ing single-variable statistic or regression calculations.
4(DRAW)
1(X)
P.98
1234
P. 105
1234