EasyManuals Logo

Casio fx-7400G PLUS User Manual

Casio fx-7400G PLUS
218 pages
To Next Page IconTo Next Page
To Previous Page IconTo Previous Page
Page #138 background imageLoading...
Page #138 background image
124
Chapter 7 Statistical Graphs and Calculations
(G-Type)
(Scat)
(XList)
(YList)
(Freq)
(M-Type)
(Auto)
(Pwr)
1234
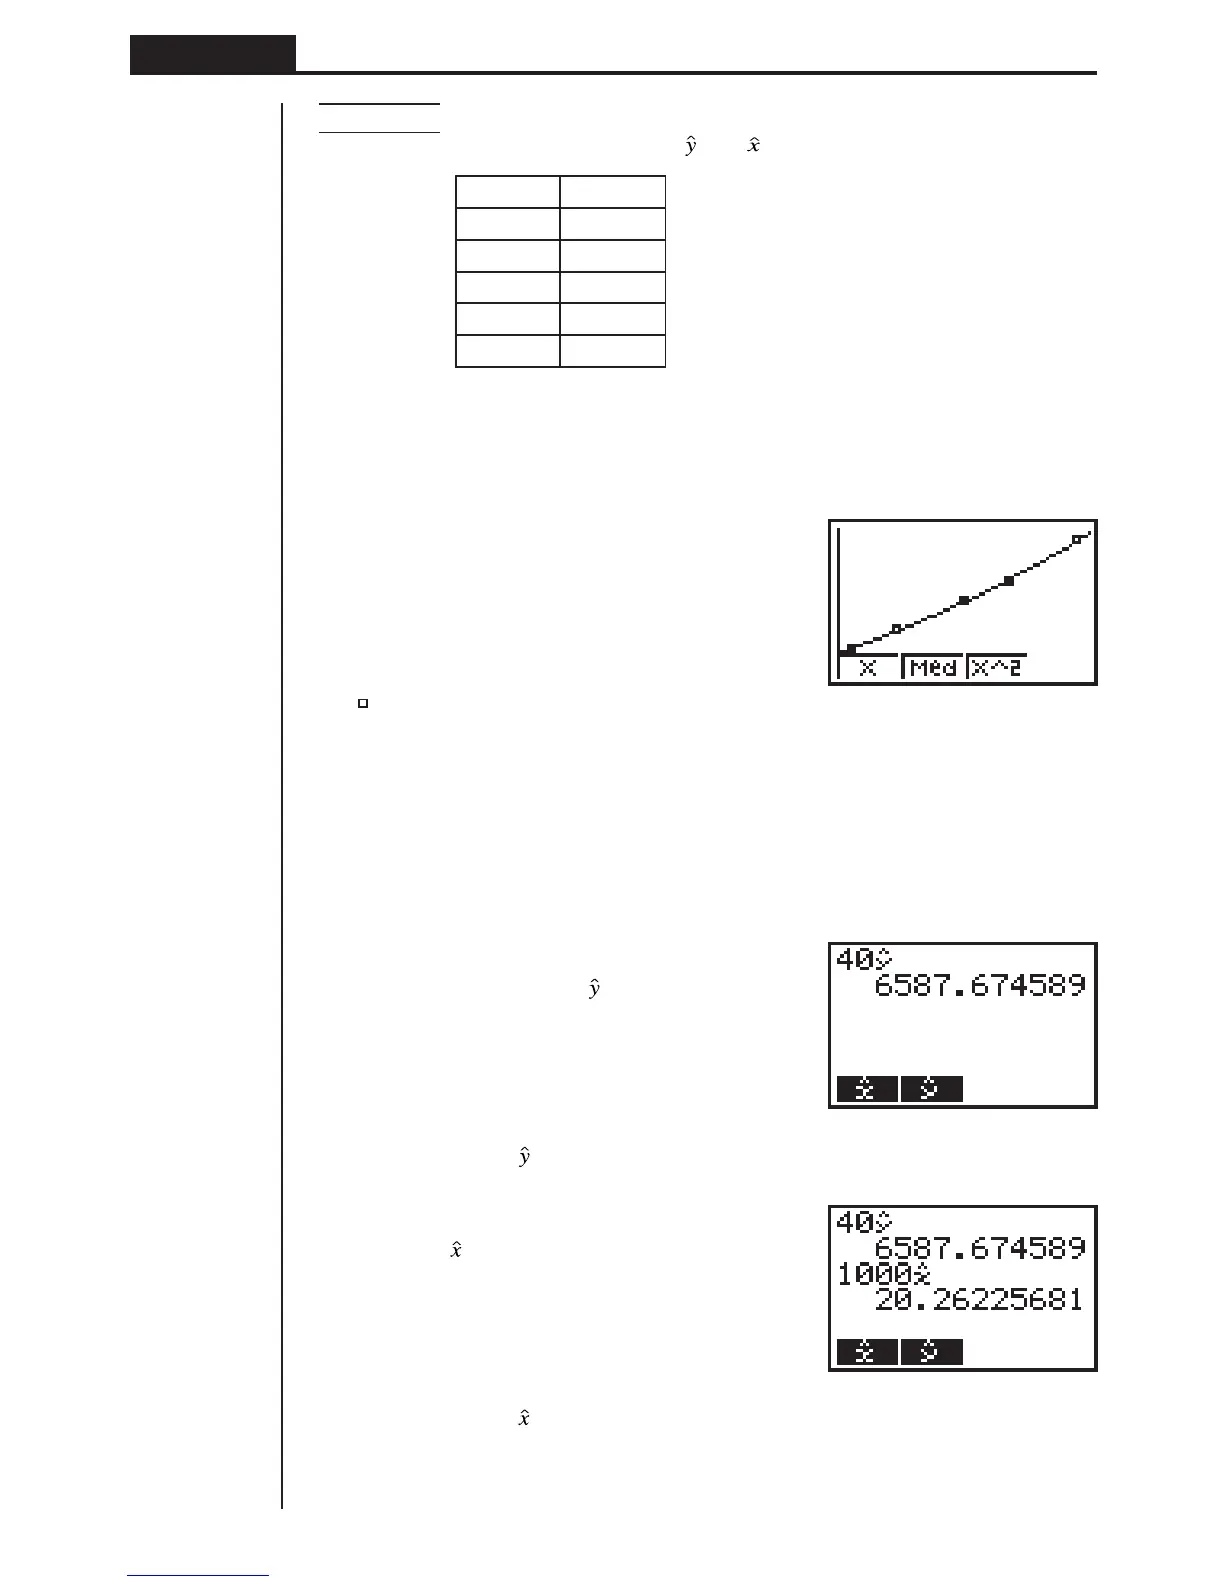
Example To perform power regression using the following data and
estimate the values of
and when xi = 40 and yi = 1000
xi (List 1) yi (List 2)
28 2410
30 3033
33 3895
35 4491
38 5717
1. In the Main Menu, select the STAT icon and enter the STAT Mode.
2. Input data into the list and draw the power regression graph.
1(GRPH)[4(SET)c
1(Scat)c
1(List1)c
2(List2)c
1(1)c
1(
)Q
!Z1(Auto)Q1(GRPH)1(GPH1)[
3(Pwr)4(DRAW)
3. In the Main Menu, select the RUN icon and enter the RUN Mode.
4. Press the keys as follows.
ea(value of
xi)
K3(STAT)2( )w
The estimated value
is displayed for xi = 40.
baaa(value of
yi)
1( )w
The estimated value
is displayed for yi = 1000.

Table of Contents

Other manuals for Casio fx-7400G PLUS

Questions and Answers:

Question and Answer IconNeed help?

Do you have a question about the Casio fx-7400G PLUS and is the answer not in the manual?

Casio fx-7400G PLUS Specifications

General IconGeneral
Modelfx-7400G PLUS
CategoryGraphing Calculator
DisplayLCD
Display Lines8
Display Characters21
Memory28 KB
Power SupplyBattery
ProgrammingYes
GraphingYes
Equation SolverYes
Statistical FunctionsYes
ConnectivityNo
BatteryAAA x 4

Related product manuals