41
Basic Calculations Chapter 2
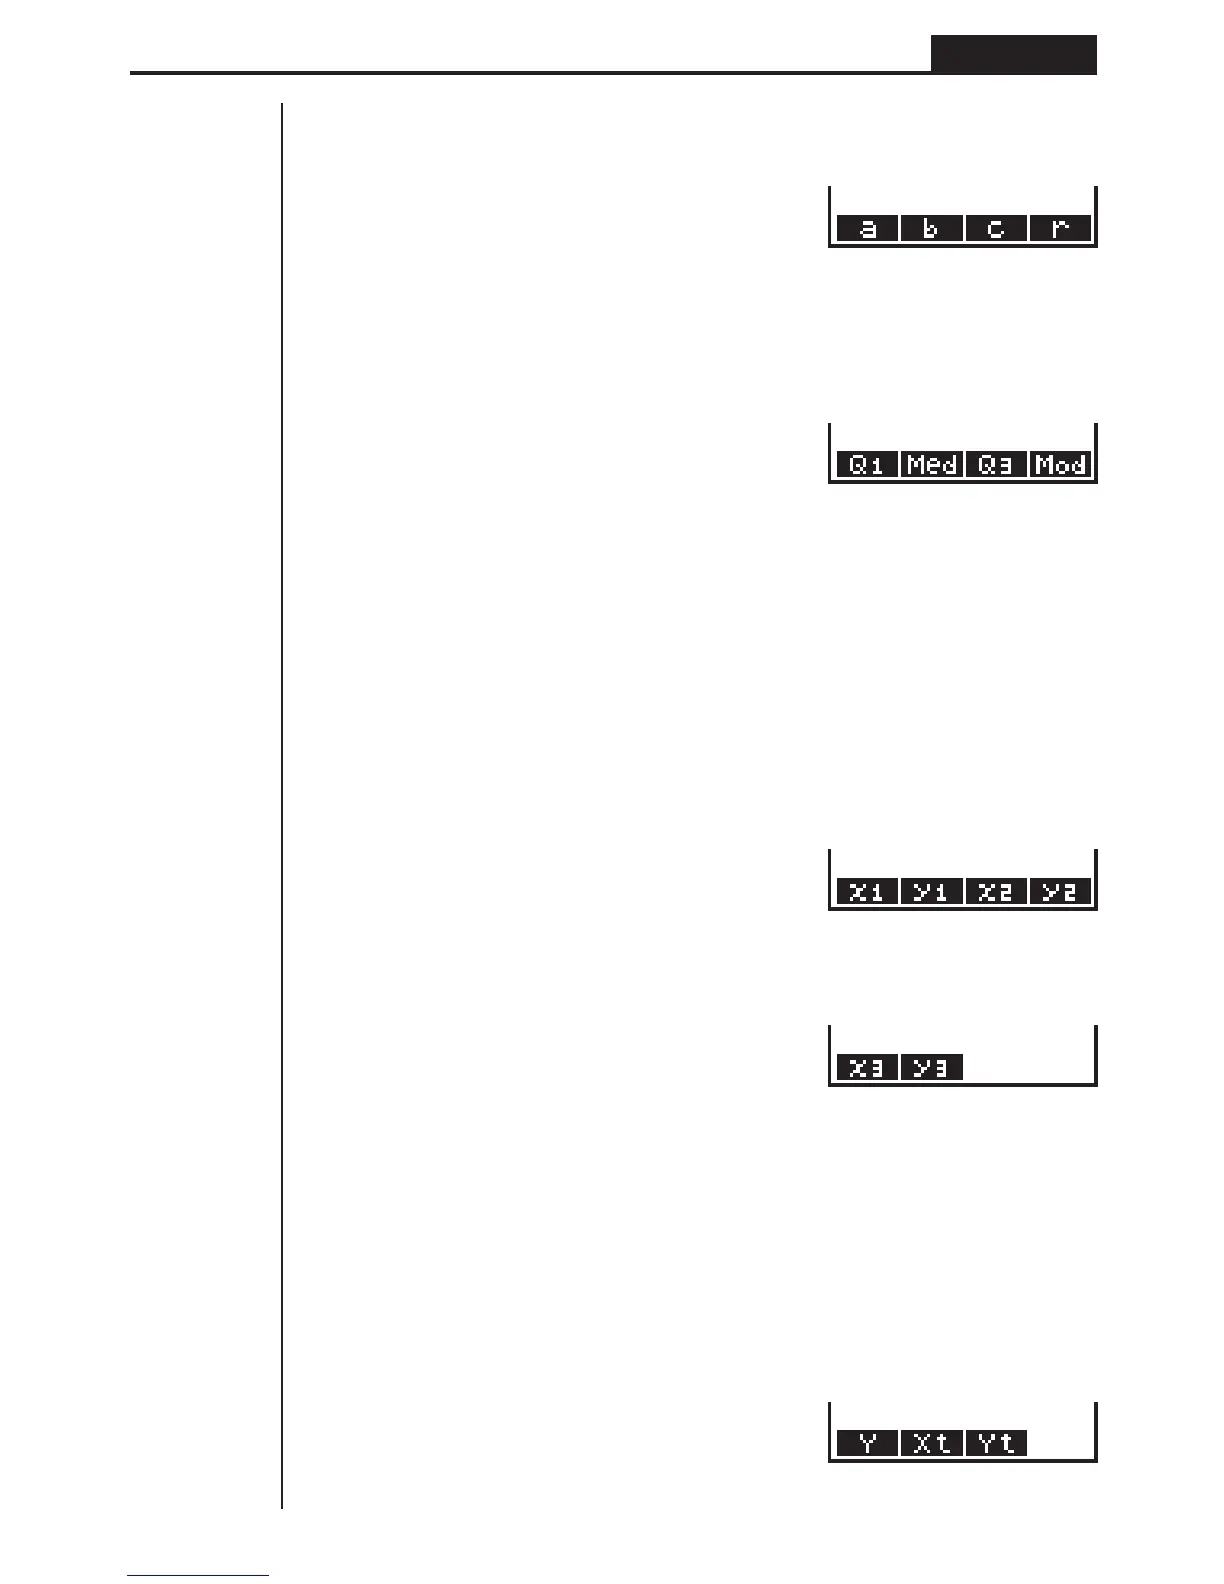
The following menu appears whenever you press 3 (GRPH) while the statistical
data menu is on the display.
3 (GRPH)
1(a)-3(c) ... Statistical graph regression coefficient and multinomial coeffi-
cients
4 (
r) ............. Statistical graph correlation coefficient
[
1 (Q1) .......... First quartile
2 (Med) ........ Median of input data
3 (Q3) .......... Third quartile
4 (Mod) ........ Mode of input data
Press [ to return to the previous menu.
The following menu appears whenever you press 4 (PTS) while the statistical data
menu is on the display.
4 (PTS)
1(x1)-4(y2) ..... Coordinates of summary points
[
1(x3)-2(y3) ..... Coordinates of summary points
Press [ to return to the previous menu.
uu
uu
uTo recall graph functions
Pressing [ and then 2 (GRPH) while the variable data menu is on the screen
displays a graph function menu.
[2 (GRPH)
1234[
1234[
1234[
1234 [
1234[
 Loading...