49
Graphing Chapter 4
2. Input a value for a parameter and press w. The calculator automatically selects
the next parameter for input.
•You can also select a parameter using the c and f keys.
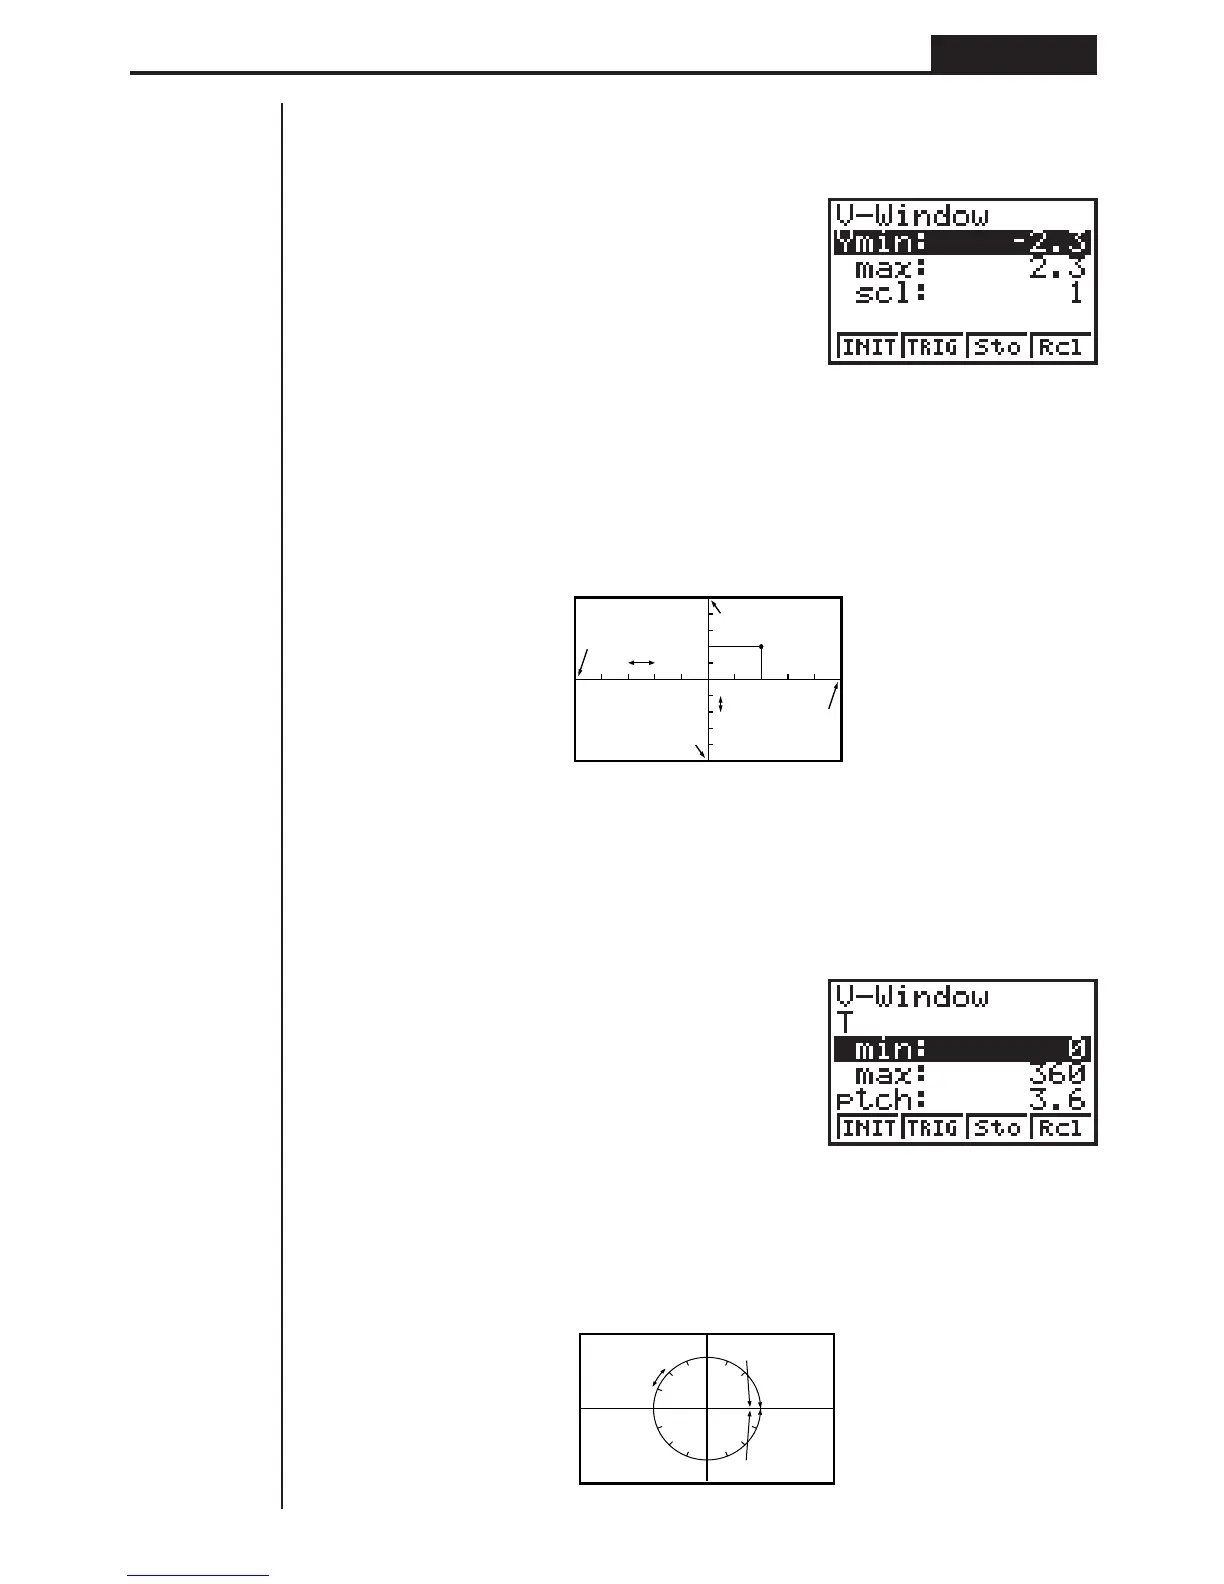
Ymin................ Minimum y-axis value
Ymax............... Maximum
y-axis value
Yscl ................. Spacing of
y-axis increments
The following illustration shows the meaning of each of these parameters.
3. Input a value for a parameter and press w. The calculator automatically selects
the next parameter for input.
• There are actually nine View Window parameters. The remaining three param-
eters appear on the display when you move the highlighting down past the Y
scale parameter by inputting values and pressing c.
Tmin ................ T minimum values
Tmax ............... T maximum values
Tptch ............... T pitch
The following illustration shows the meaning of each of these parameters.
X max
Y scl
Y min
Y max
(x, y)
X min
X scl
min
max
ptch
(
X, Y
)