16-16
3. Select the sketch operation you want.
!4(SKETCH)1(Cls) … Clears plotted points and written text.
2(Plot) … Plots a point.
3(Text) … Inserts text.
4. Use the cursor keys to move the pointer (
) to the location you want.
5. To plot a point: Press w.
To insert text: Input a text string.
Displaying the Cross Section of a 3D Graph
You can display a vertical plane on the x-axis, y-axis, or z-axis to emphasize a cross section
(the location where the plane and the 3D graph overlap).
Note
A cross section can be displayed only for a 3D graph that was drawn using a template (Line,
Plane, Sphere, Cylinder, Cone).
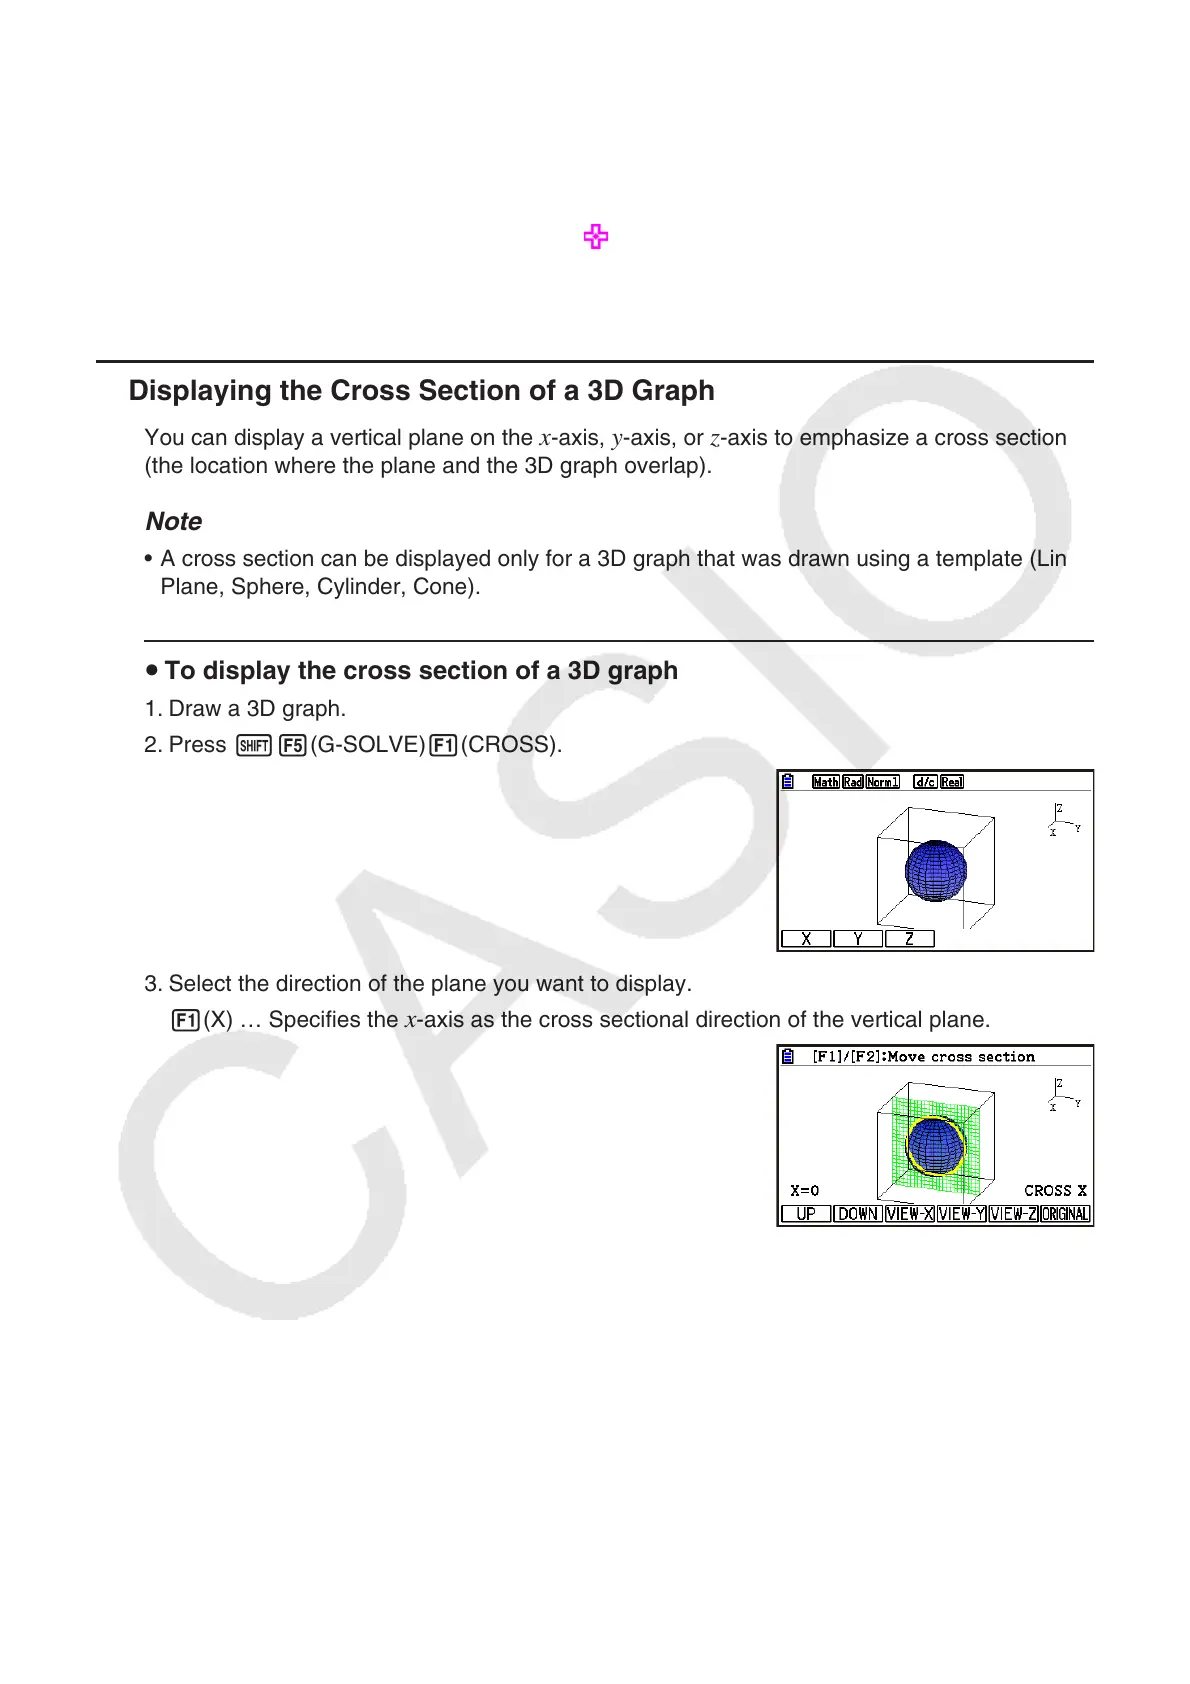
To display the cross section of a 3D graph
1. Draw a 3D graph.
2. Press !5(G-SOLVE)1(CROSS).
3. Select the direction of the plane you want to display.
1(X) … Specifies the
x-axis as the cross sectional direction of the vertical plane.
k
•
u