Operation
Understanding the Fishfinder screen
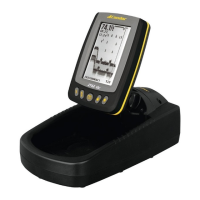
This chart shows all the information that your Fishfinder display during the operation. The
upcoming sonar information will firstly appears in the Real-time sonar window, and then
scrolls across the screen from right to left. So, what you see on the screen (Fish symbols,
Fish arches, bottom shape, etc.) is formed by the sonar history.
The black line at the top of the screen represents the water surface, and the water depth
and Temp will appear at the upper left corner as soon as you turn on the sonar unit and the
transducer was properly connected.
By moving the transducer slowly at a steady speed, you could see the bottom shape shown
at the bottom of the screen.
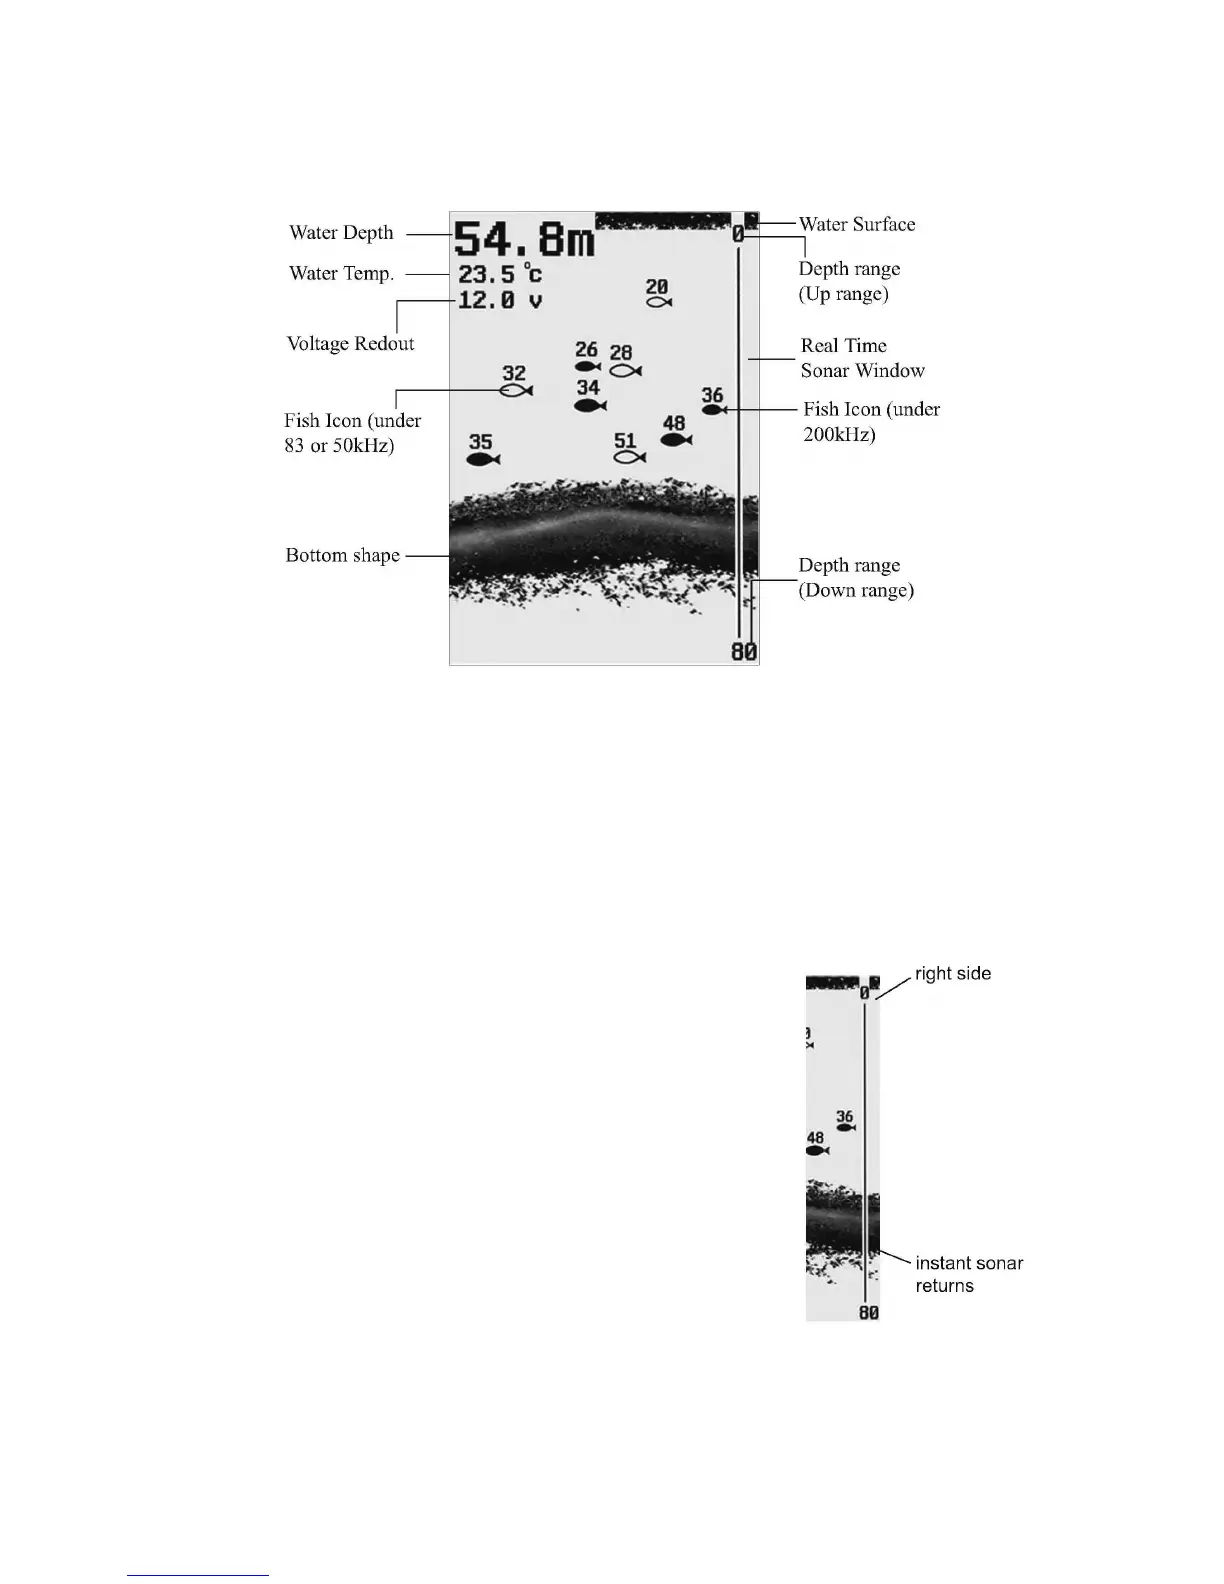
Real Time Sonar Window
The plot on the screen demonstrates the sonar history, which
varies at different time segment. So, considering the boat and
targets may continually move when the sonar works, the
information displayed on the screen only shows the time
segment when the targets were detected.
To understand the display correctly, you could imagine
dividing the screen into many parallel “bands” at vertical
direction. Each “band” represents the signals received by the
sonar unit at a particular time. The closer the position of
“brand” to the right side is, the latest signal it represents.
With the Real Time Sonar window, you could observe the
fastest updating which will show you the instant time segment when the targets are
detected u the instant underwater information, including depth, bottom, structure, and fish
being detected.