Joule 3.0 User Guide page 23
Chapter 2: Dashboard Mode
Dashboard Categories
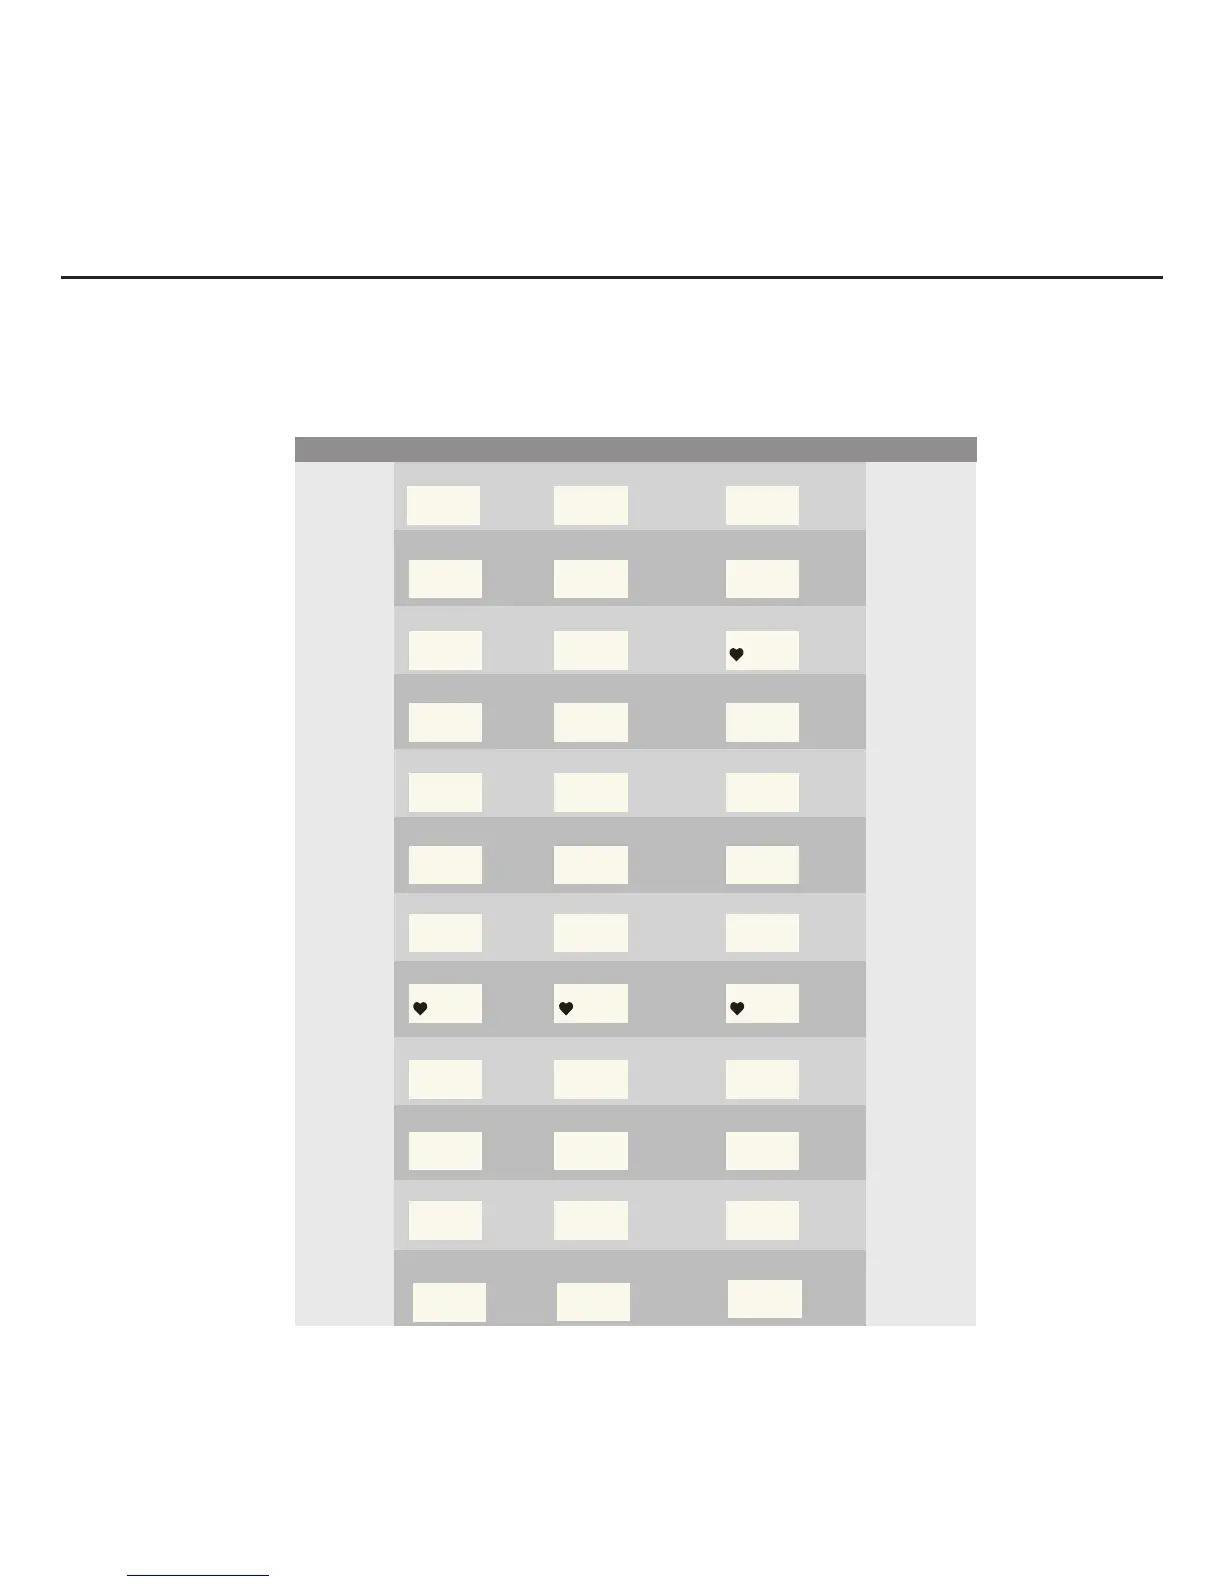
Each dashboard category is made up of three metrics. There are twelve available dashboard cat-
egories. Press and hold [JOYSTICK] to change the metric category displayed in the dashboard.
Category Metric 1 Metric 2 Metric 3
Watts
watts average watts
average watts/kg
current power zone average power zone
maximum watts/kg
maximum watts
Watts/kg watts/kg
Zones
Peak Power
Scores
Work
Speed
V A M
2999 29992999
W ATTS
W/KG
A V W ATTSMXWAT TS
20.0
PWR ZONE
6
A V PWR ZN
4.2
heart rate zone
HR ZONE
3
5sec Peak Power 5min Peak Power
5 SEC
2999
5 MIN
2999
20 min Peak Power
20 MIN
2999
training stress score normalized power
TSS
500.1
NORM PWR
2999
intensity factor
IF
2.000
kilojoules kilojoules / hour
KJ
9999
KJ/HR
9999
training stress score
TSS
9999
RPM
rpm
average rpm
CAD
250
A V CAD
250
maximum rpm
MX CAD
250
current speed
average speed
MPH
99.9
A V MPH
99.9
maximum speed
MX MPH
99.9
current grade
current altitude ft or m
current altitude ft or m
% GRADE
45.0
ALT FT
ALT FT
total ascent ft or m
total ascent ft or m
FT GAIN
9999
vertical ascent
V A M
Heart Rate
% Grade
heart rate
average heart rate
HR
250
A V HR
250
MX HR
250
maximum heart rate
A V W/KG
20.0
MX W/KG
20.0
Ride
ride time
99:59:59
MILE
99.99
ride distance
RIDE TIME HR
29999
9999
FT GAIN
45.0
kilojoules
9999
KJ
29999