35
DRIVE DATA
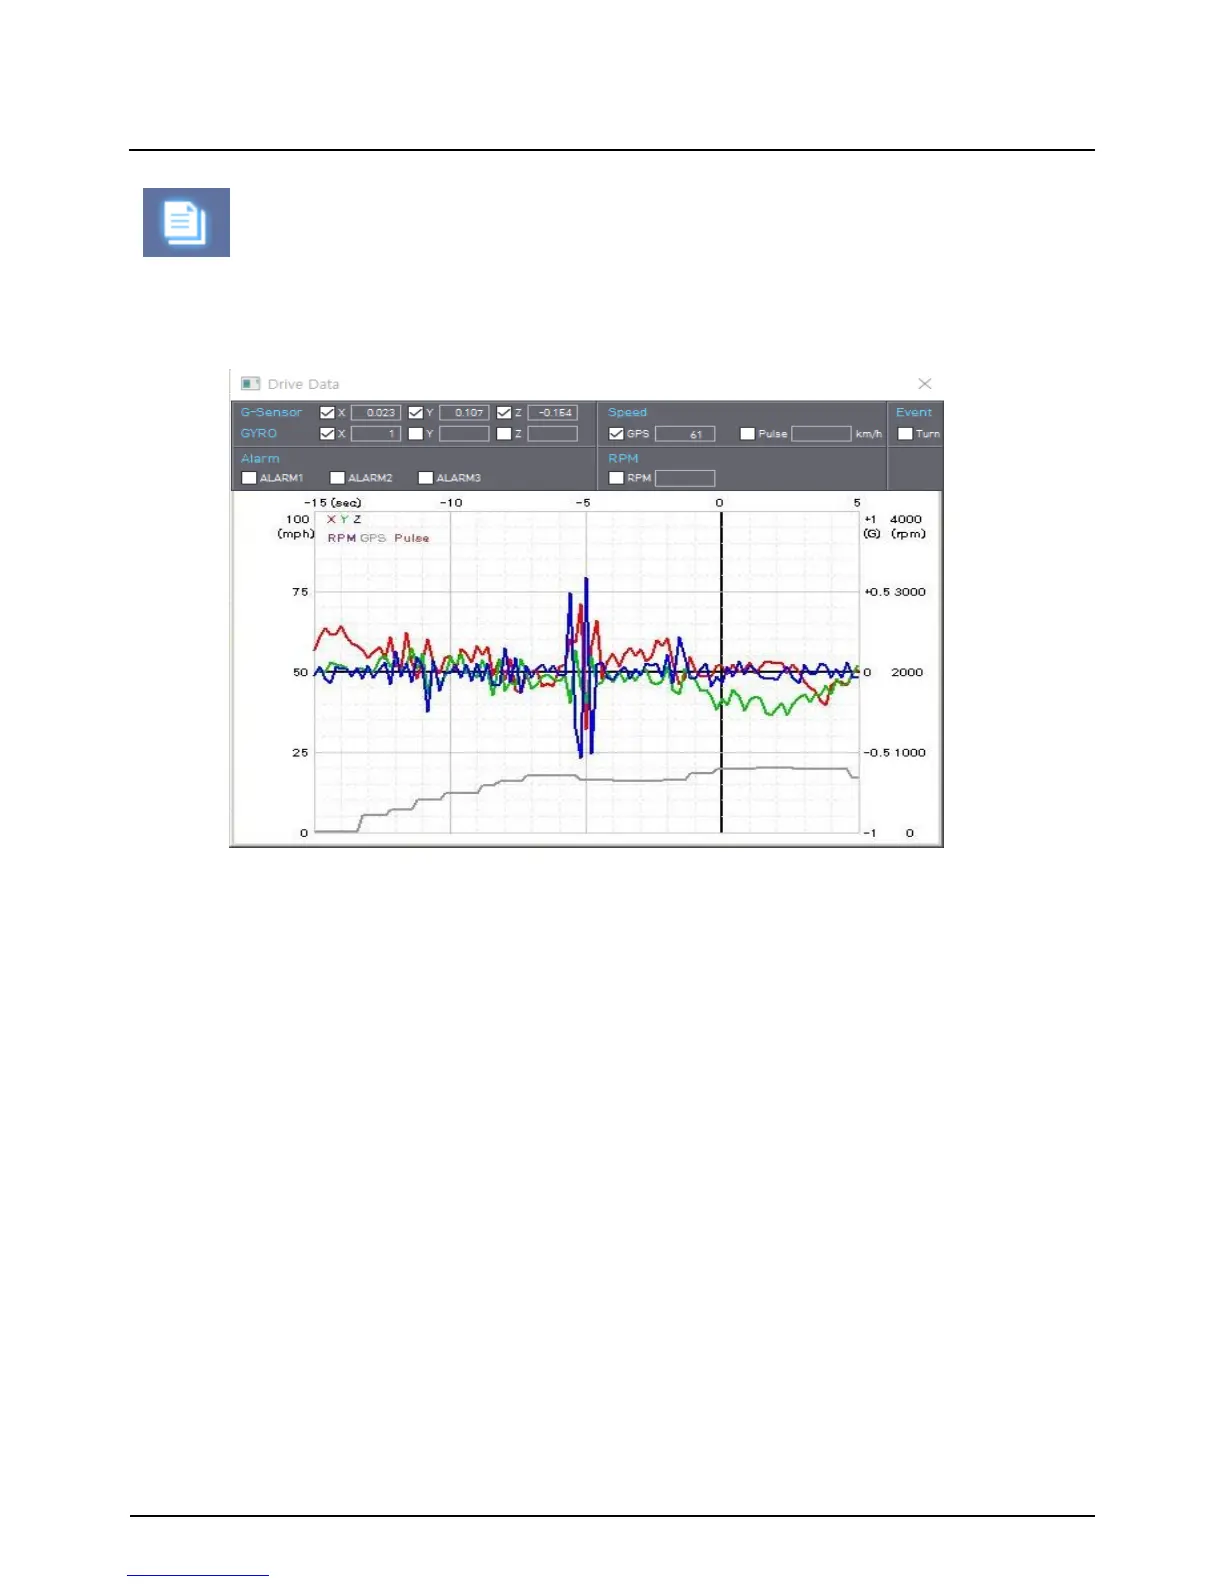
The default setting only displays the G-sensor graphs but other information may be
added by checking the boxes in the upper part of the screen.
G sensor X value: Front & Back (like Quick brake or Quick Start)
G sensor Y value: Left & Right (like Quick Turn)
G sensor Z value: Up & Down (like prominence and depression)
“Drive Data” icon
G-Sensor: (X axis: red, Y axis: green, Z axis: blue, based on the positioning of the
main unit) is shown with the data reference point zero-point calibrated and positive
shocks as (+) and negative shocks as (-).
GYRO: display the gyro value
Speed: GPS measured speed is displayed in grey. .
RPM: The RPM is displayed in purple.
ALARM: The alarms are displayed on the bottom of the screen with the grey bar
meaning the trigger is activated.