 Loading...


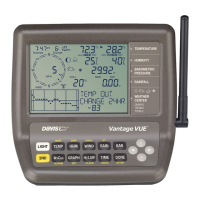
Do you have a question about the DAVIS Vantage Vue and is the answer not in the manual?
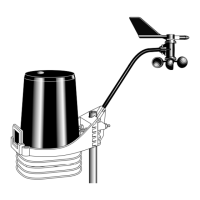
| Wind Speed Range | 2 to 150 mph (3 to 241 km/h) |
|---|---|
| Rain Collector Resolution | 0.01 in (0.2 mm) |
| Rain Collector Type | Tipping bucket |
| Update Interval | 2.5 seconds |
| Temperature Accuracy | ±1°F (±0.5°C) |
| Humidity Accuracy | ±3% |
| Wireless Transmission Range | up to 1000 ft (300 m) |
| Humidity Range | 1 to 100% RH |
| Wind Direction | 0 to 360° |
| Wind Direction Accuracy | ±3° |
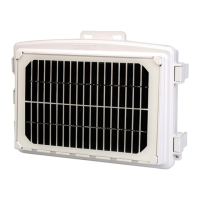
| Power Supply | Solar-powered with battery backup |
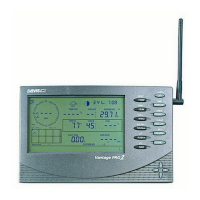
| Console Display | LCD with backlight |
| Power (Console) | 3 C batteries or AC adapter |
| Wind Speed Accuracy | ±2 mph (±3 km/h) or ±5%, whichever is greater |
| Solar Radiation Sensor | Not included |
| UV Sensor | Not included |
| Rain Measurement Accuracy | ±4% at rates up to 2 in (50 mm) per hour |