EasyManuals Logo

DAVIS Vantage Vue Quick Reference Guide

DAVIS Vantage Vue
28 pages
To Next Page IconTo Next Page
To Previous Page IconTo Previous Page
Page #26 background imageLoading...
Page #26 background image
25
Diagnostic
Screens
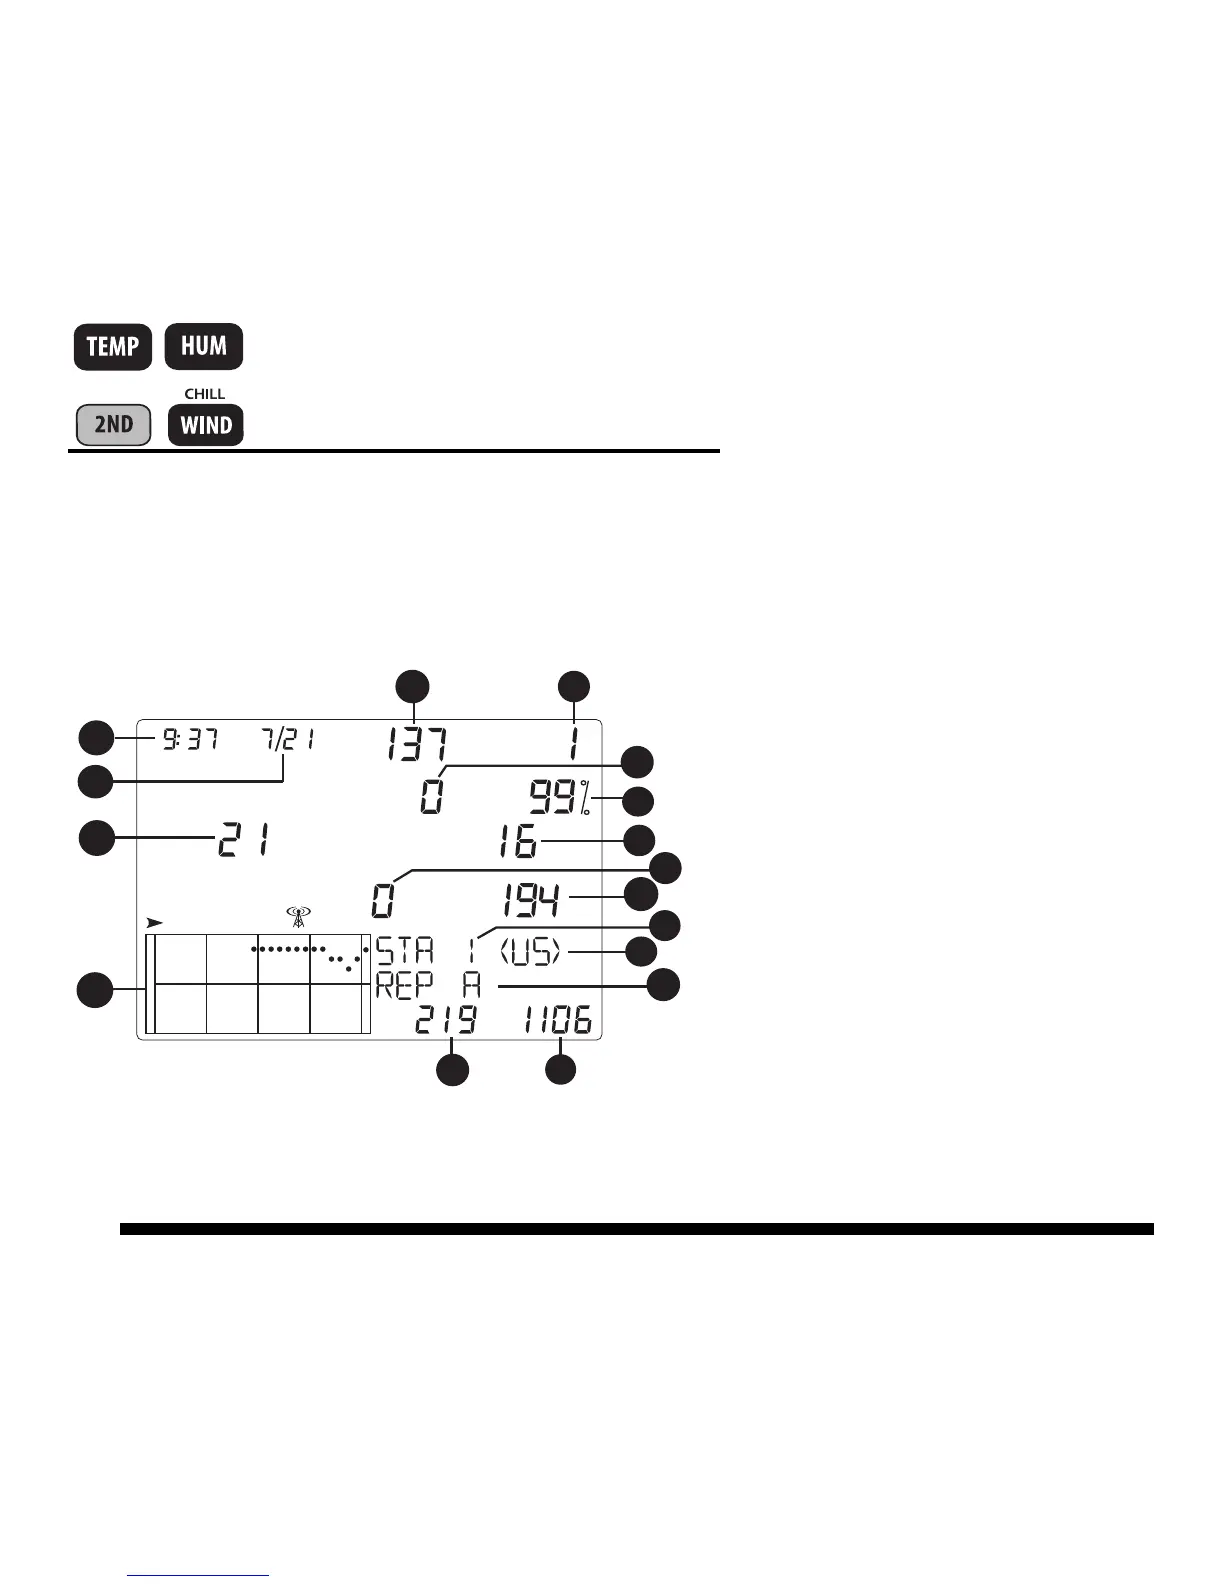
To Display the Console Diagnostic Screens:
Press and hold TEMP then press HUM to display the Statistical Diagnostic
Screen.
Statistical Diagnostic Screen:
1. Time or number of closed
anemometer reed switch*
2. Date or number of open
anemometer reed switch*
3. CRC errors
4. Firmware version
5. Longest streak of bad packets
6. Console resynchs
7. % Good packets
8. Total bad packets.
9. Current streak of bad packets
10. Current streak of good packets
11. Station number
12. Transmitter domain
13. Repeater ID
14. Total good packets received
15. Longest streak of good packets
am
1
2
3
4
5
6
7
8
9
11
10
12
13
14
15
7

Other manuals for DAVIS Vantage Vue

Questions and Answers:

Question and Answer IconNeed help?

Do you have a question about the DAVIS Vantage Vue and is the answer not in the manual?

DAVIS Vantage Vue Specifications

General IconGeneral
Wind Speed Range2 to 150 mph (3 to 241 km/h)
Rain Collector Resolution0.01 in (0.2 mm)
Rain Collector TypeTipping bucket
Update Interval2.5 seconds
Temperature Accuracy±1°F (±0.5°C)
Humidity Accuracy±3%
Wireless Transmission Rangeup to 1000 ft (300 m)
Humidity Range1 to 100% RH
Wind Direction0 to 360°
Wind Direction Accuracy±3°
Power SupplySolar-powered with battery backup
Console DisplayLCD with backlight
Power (Console)3 C batteries or AC adapter
Wind Speed Accuracy±2 mph (±3 km/h) or ±5%, whichever is greater
Solar Radiation SensorNot included
UV SensorNot included
Rain Measurement Accuracy±4% at rates up to 2 in (50 mm) per hour

Related product manuals