6.1. Swing Fingerprint Walk-through
Let’s take a look at your Swing Fingerprint!
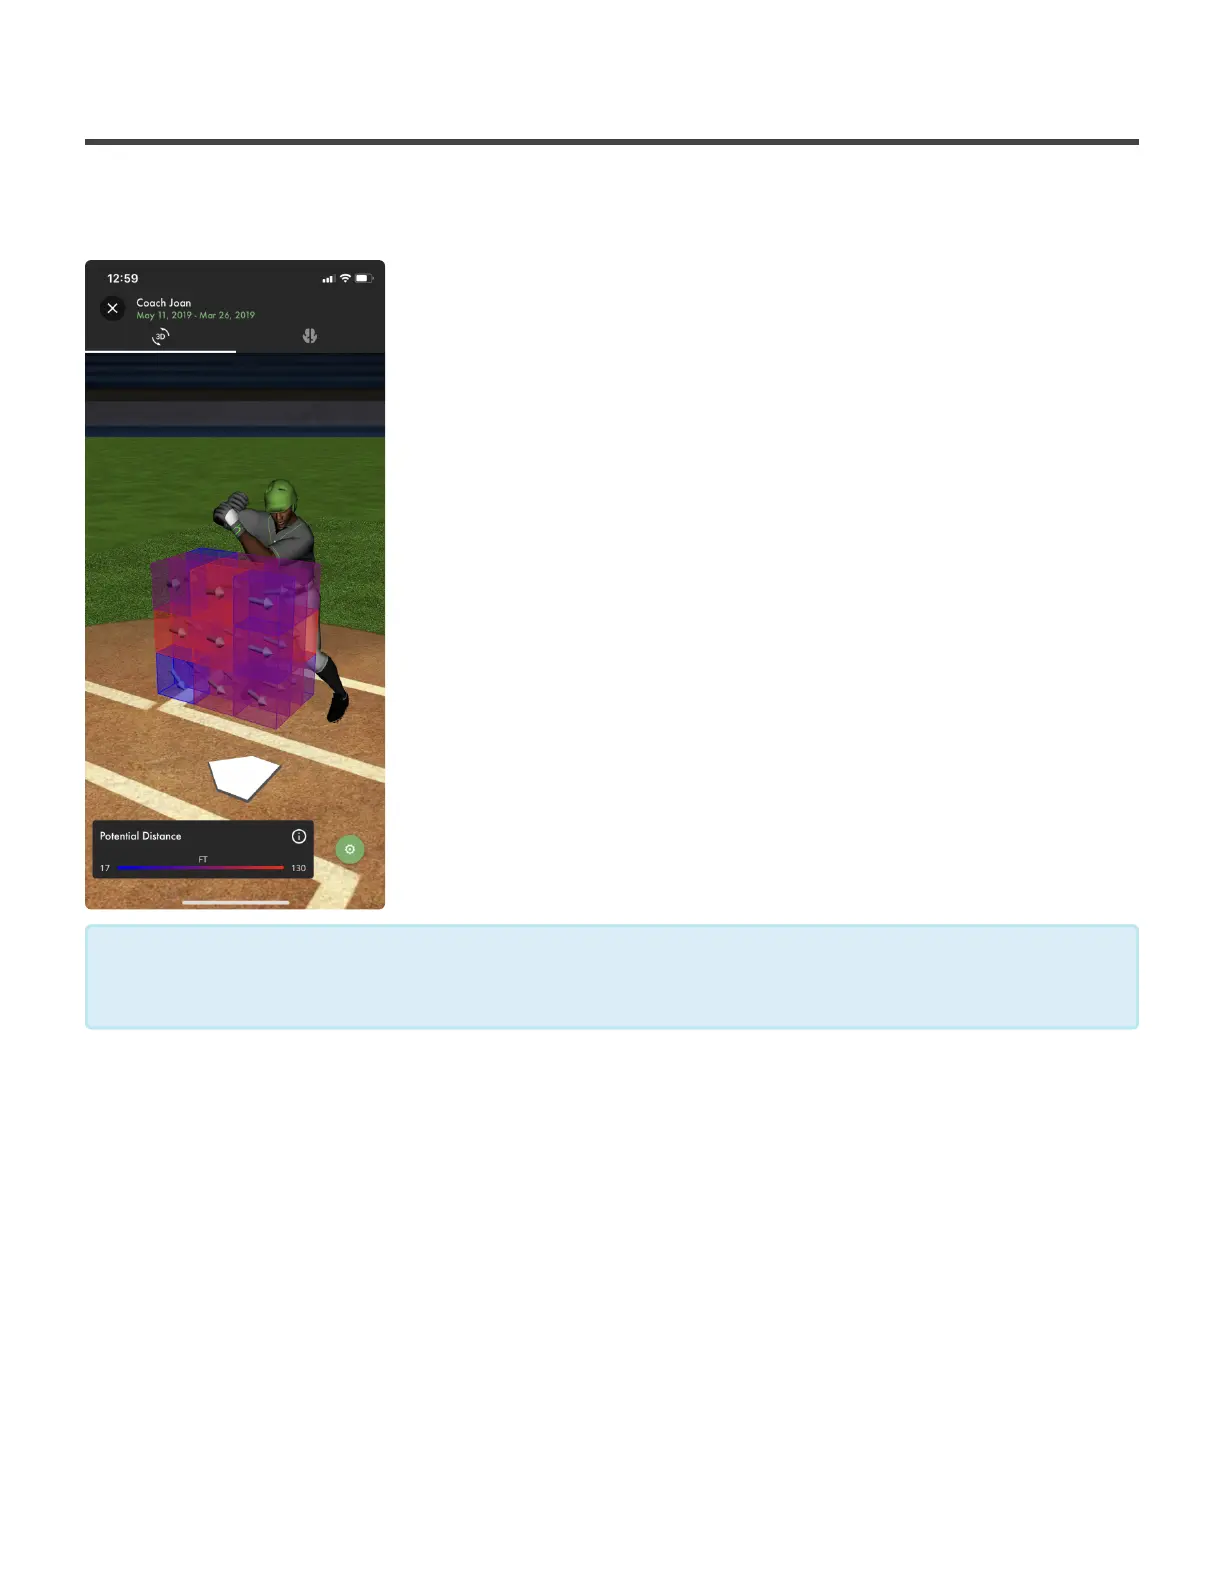
The first screen you’ll be taken to is your 3D heat map made up of cells
that represent different locations in the strike-zone. At the top of the
screen you’ll see your name and the date range in which your swings
were selected. Underneath you’ll see a 3D icon with two curved arrows
and a brain icon. The majority of the page will be taken up by a 3D figure
and your Swing Fingerprint.
What do the colors mean?
The smaller cells range in color from blue to red. The more blue a cell is,
the lower the potential distance is for balls hit in that location of the strike-
zone The more red a cell is, the higher the potential distance is for balls
hit in that location of the strike-zone. Red cells are the locations in which
you hit the ball the best. Blue cells are the locations that need
improvement.
What are the arrows?
Each colored cell will have an arrow inside of it. This arrow represents your average Barrel Slot of swings to
hit pitches in that location. Barrel Slot is the direction the sweet spot of the bat is going for 6 ball lengths
prior to the impact point.
The Legend
At the bottom of the page you’ll find the legend for your color scale (potential distance scale). The legend
shows a line that fades from blue to red, with your lowest and highest potential distance at each end. This is
used to give you an idea of the potential distance for each cell in your Swing Fingerprint.
The potential distance for each colored cell is determined using a combination of the Max
Barrel Speed and the Attack Angle from each swing where contact was in a cell
*
Diamond Kinetics SwingTracker - 1
Page 31 of 107