44
Graphs can be saved in each of the three
pneumatic functions; Vacuum Level,
Pulsator Ratio and Milk/Rest Ratio. To print
the graphs to the Digimet printer use the
item 3 Print Graph in the Utility Menu.
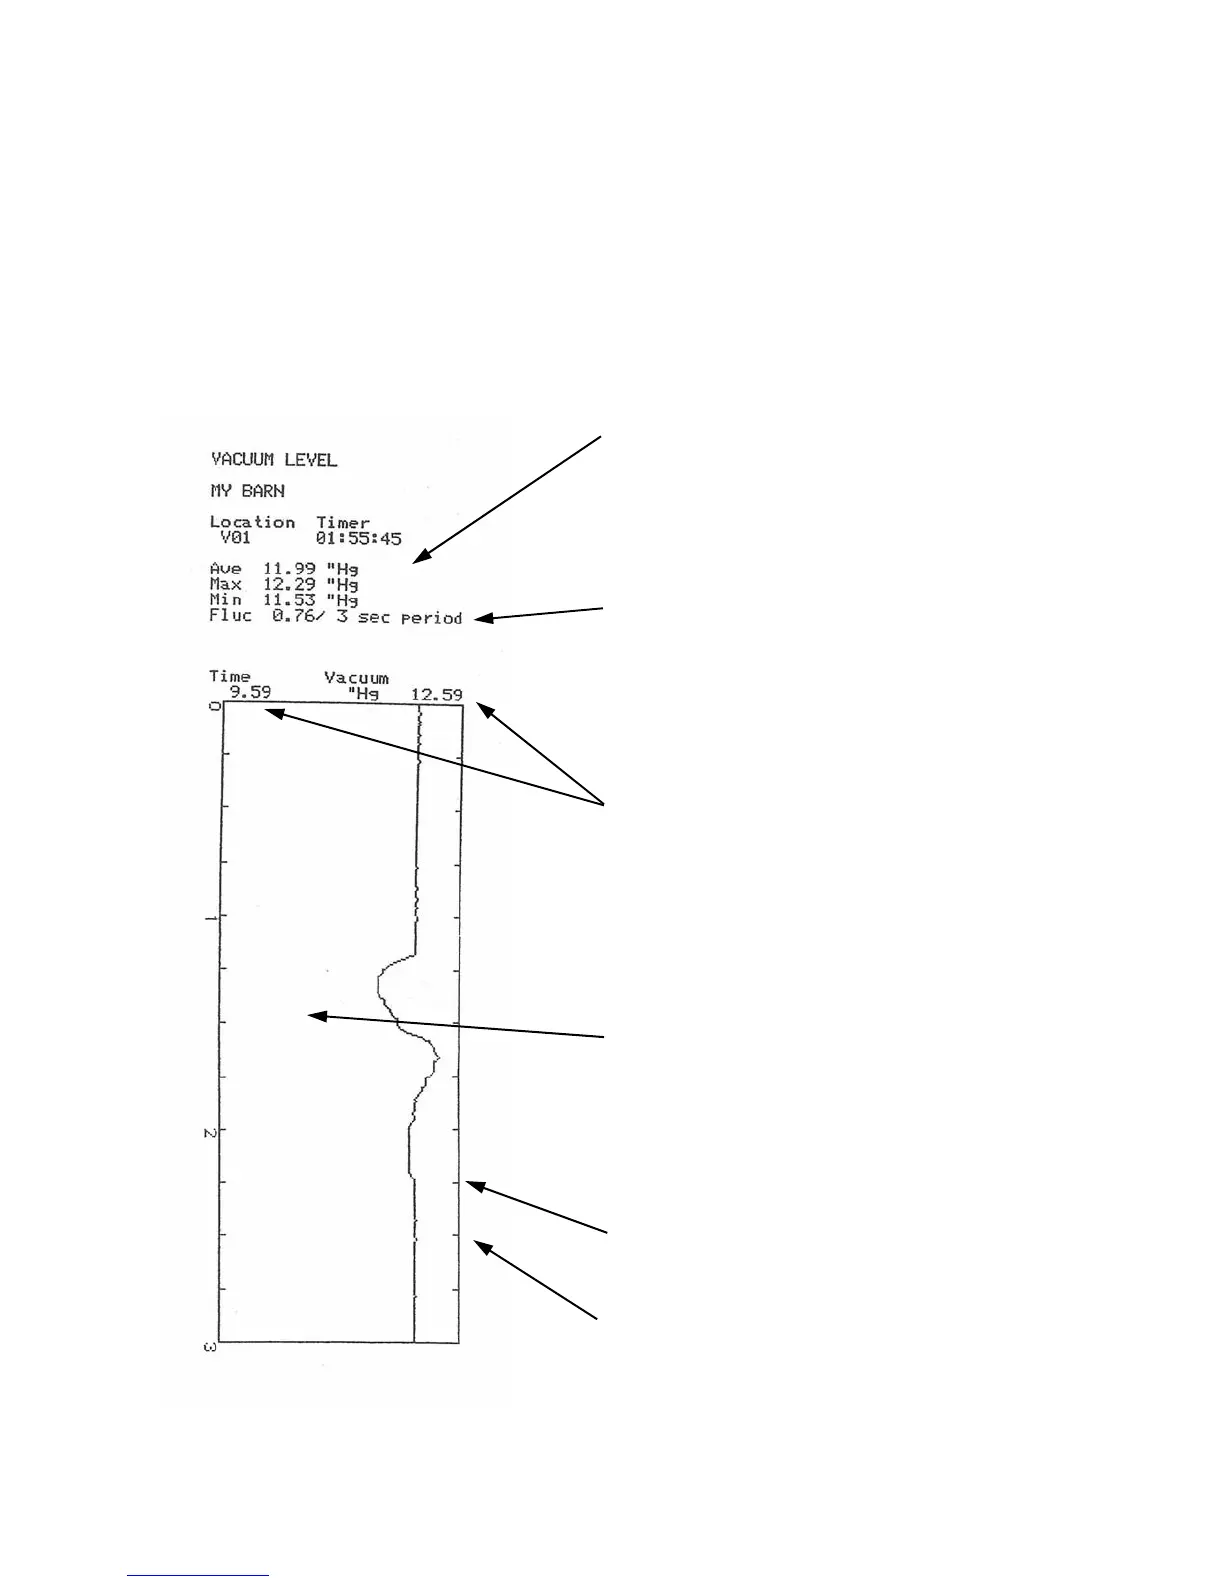
A Vacuum Level graph and associated
numeric data is shown below:
The numeric data is listed in the same manner
as the Vacuum Level print-out data on the
previous page.
Note: This graph has a 3 second Fluctuation time
frame and also a 3 second graph. It is not
mandatory that this be done in this manner but it
is recommended, because the Min, Max and
Fluc. figures will then directly be represented
in the graph.
At the top of the graph there are two vacuum
level figures. They represent the span of the
graph ie the minimum vacuum level that can be
represented on the graph and the maximum level
that can be represented on the graph. These
figures are not the min. and max .of the data.
Vacuum Level graphs will indicate a minimum
span of 3 ”Hg or its kPa equivalent if the min.
and max. vacuum levels are within a 3 inch span.
Otherwise the minimum and maximum borders
of the graph will be .3 above maximum and .3
below minimum.
Tick marks are indicated each 250 milliseconds
and each second is marked by a numeral.
The Ave. figure in Vacuum Level graphs is for
the last 500 milliseconds of the graph period
and not the average for the entire graph
period.