46
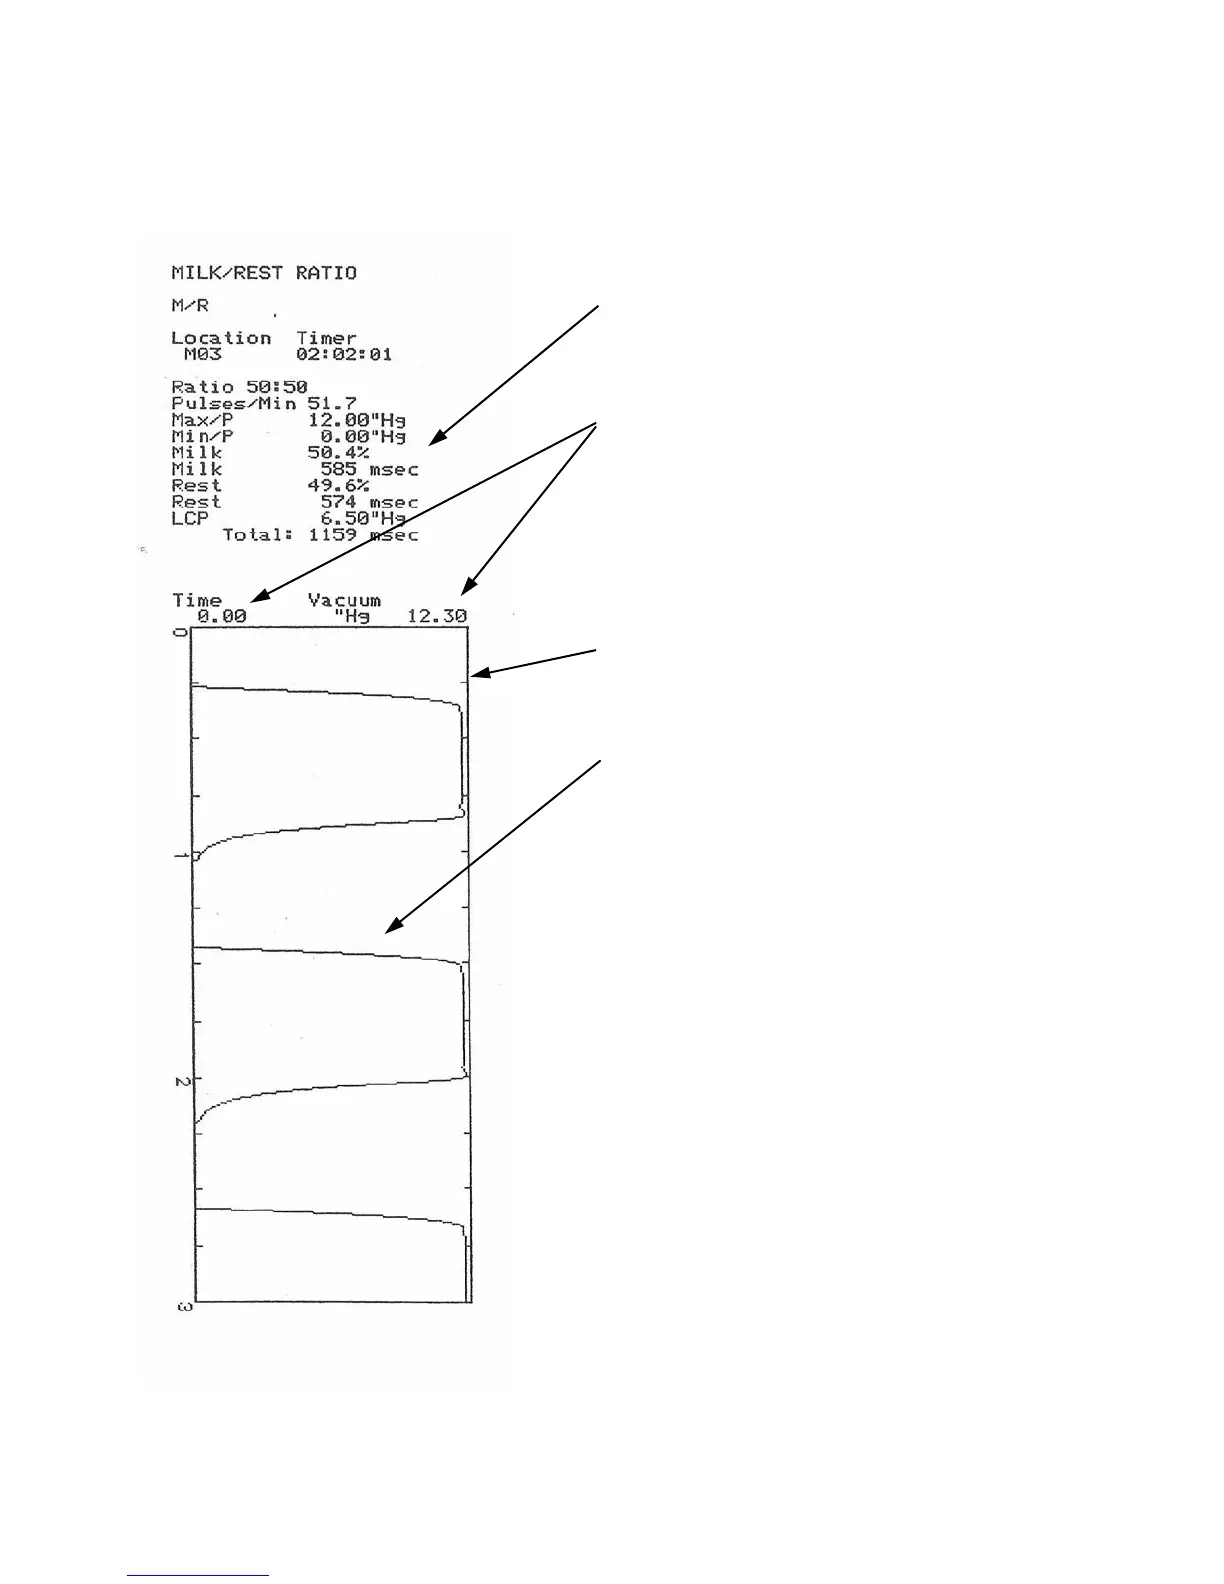
A Milk/Rest Ratio graph and associated
numeric data is shown below:
The numeric data is listed in the same manner
as the Milk/Rest Ratio print-out data on the
previous page.
The minimum and maximum borders of the
graph are indicated at the top. The maximum
border will be .3” Hg above the maximum
obtained vacuum level. If the minimum goes to
0.00 then the minimum border will be 0.00.
Otherwise, the minimum will be .3”Hg lower
than the minimum obtained vacuum level.
Tick marks are indicated each 250
milliseconds with each second indicated by a
numeral.
Note: The numeric data at the top of the
print-out, Ratio, Milk% etc. is calculated
from the last complete waveform which
appears on the graph. This means that if part
of the last pulsation waveform is cut-off then
the numbers represent the complete waveform
preceding it.
Since there is no Fluctuation time frame in the
Milk/Rest Ratio function it is not necessary to
match the Fluctuation time frame from the
Vacuum Level function with the graph period
desired for Milk/Rest Ratio graphs.