Leaders in Pipeline Survey Systems
2 - 19
OPERATING MANUAL
PART 1 – OPERATION
AVW 150203 – 2010O&MPt1-Sec2.DOC
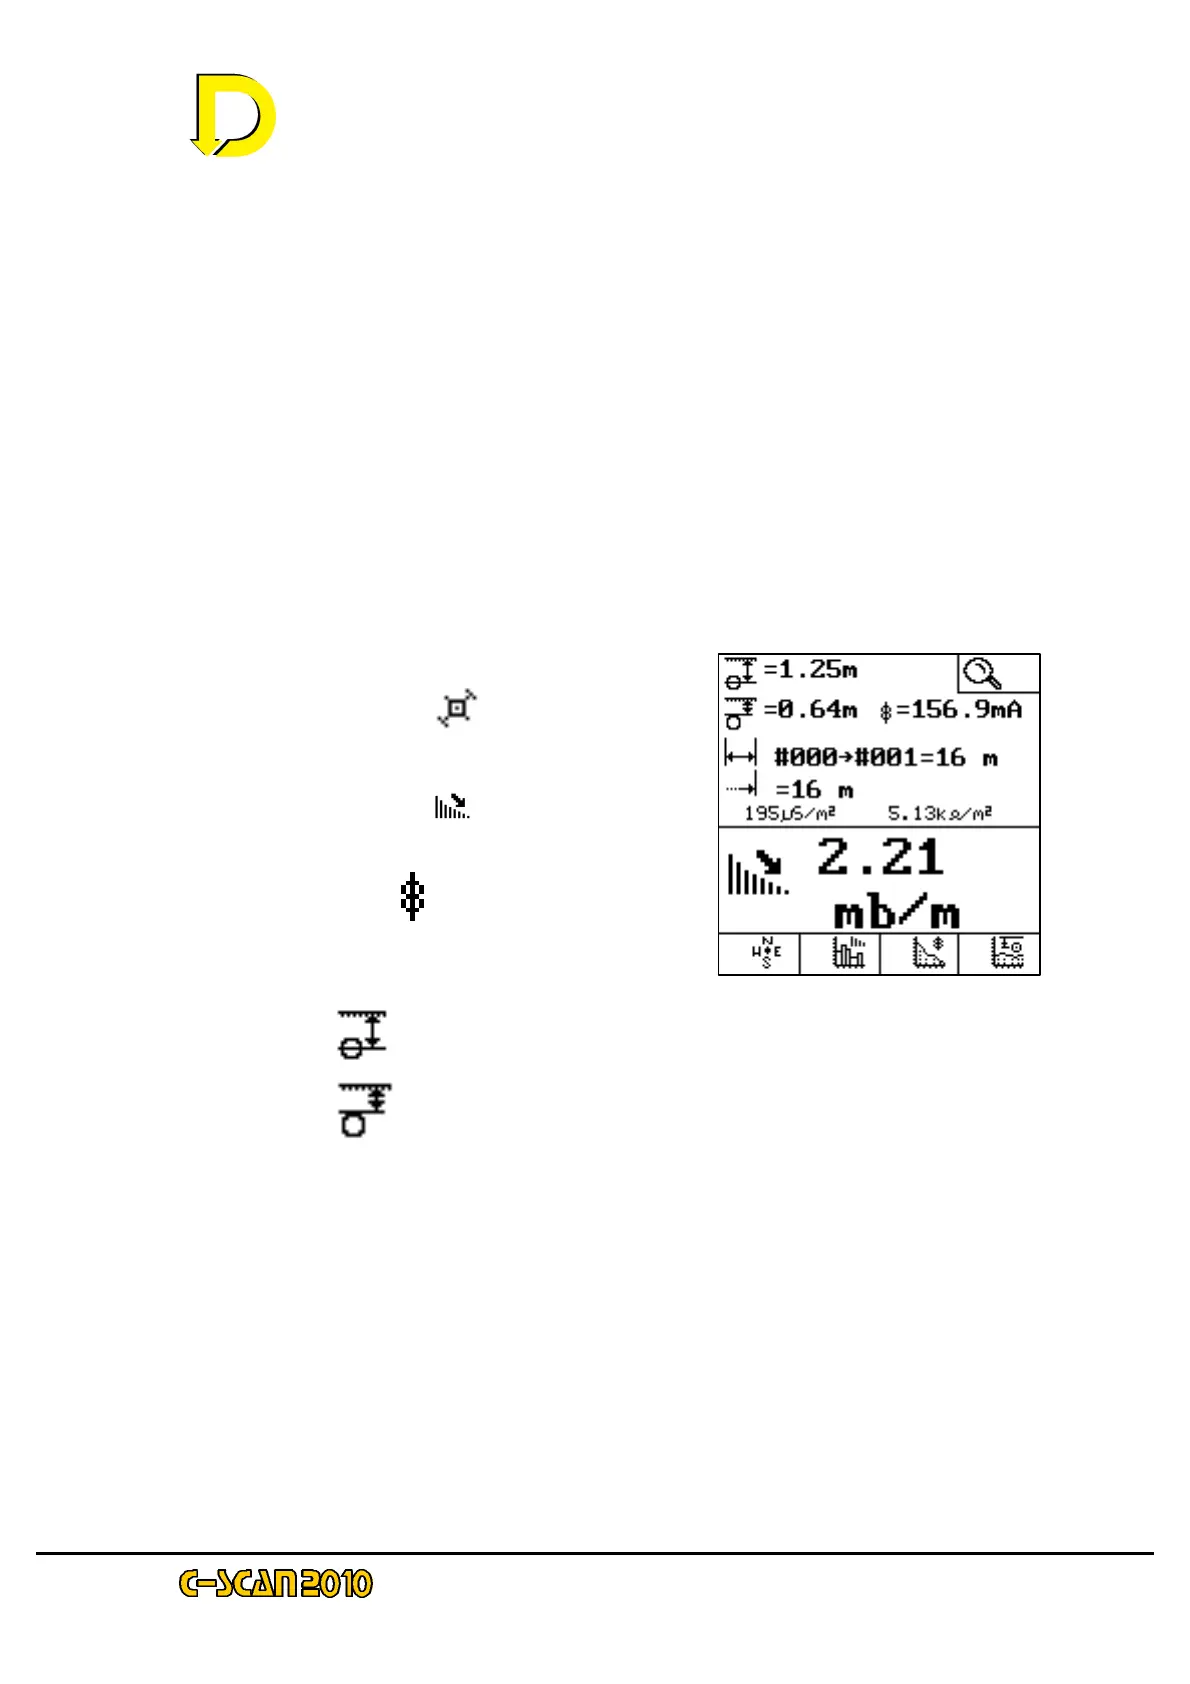
signal set on the signal generator and of the ground conditions. It is solely determined
by the average condition of the coating between the two locations and by the area of
pipeline coating in contact with the ground, per metre (or per foot) of pipeline – or in
other words: the pipeline diameter. For a pipeline of a given diameter, the attenuation
value is an absolute indicator of wrap condition. The lower the figure, the better. If
comparing two pipelines of different diameters but with identical wrap condition, the
attenuation values will be proportional to the diameter.
Press the tick box key now to continue.
2.3.6 Graphs
The next screen allows graphs to be plotted on the screen to provide the operator with a
quick method of viewing the data so far acquired, without having to download to a
computer.
They newly available keys are now:
GPS POSITION PLOT [ ] – this shows
a plan view of the pipeline to scale.
ATTENUATION PLOT [ ] – this shows
a bar graph of the attenuation on this section
of the pipeline
CURRENT PLOT [ ] – this shows the
absolute current over the surveyed sections
-
centre line [ ] of the pipeline
or cover [
– now just practice by continuing with your survey.
– the Graphs screen