Leaders in Pipeline Survey Systems
4 - 8
OPERATING MANUAL
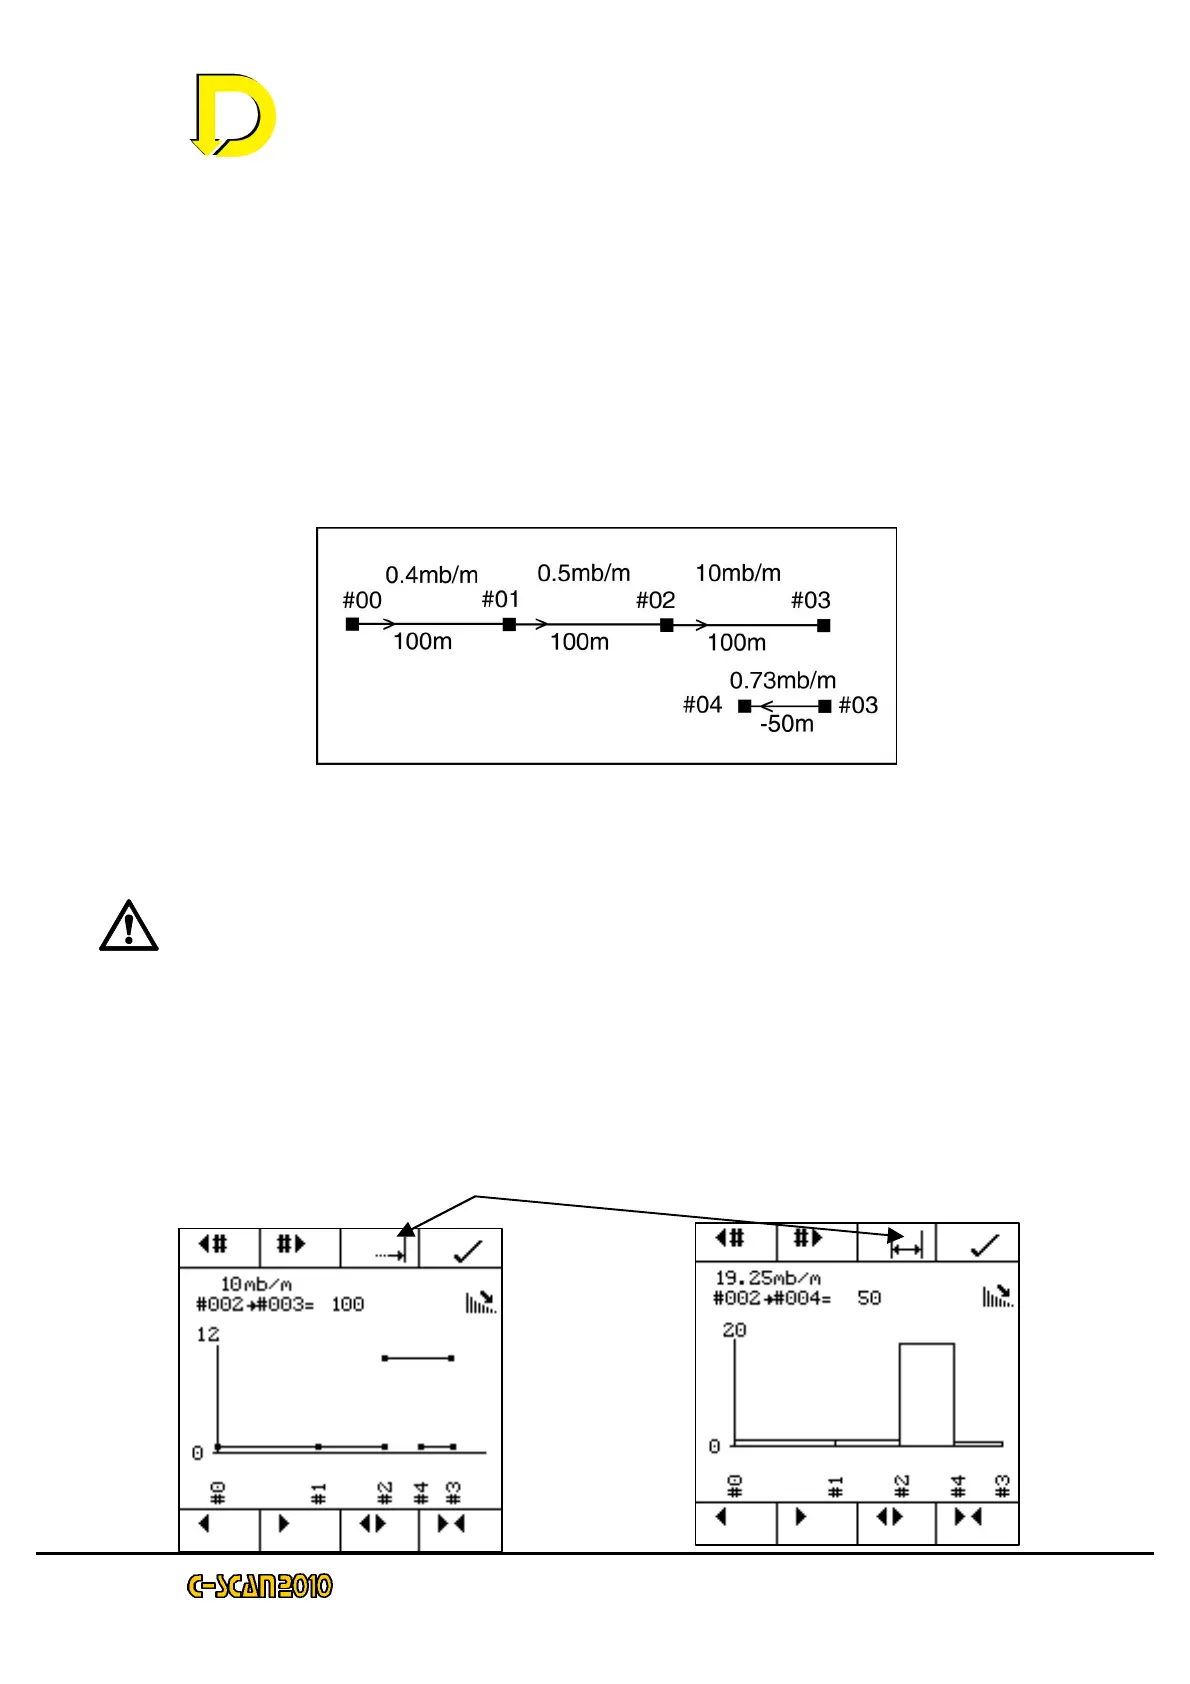
4.6 Direction change within a survey
There are occasions where a survey is proceeding and every point survey is
producing good results i.e. attenuations less than 1 mB/m. But then a section is
encountered that has a high attenuation (say 10 mB/m). If the gap between each
point has been 100m we do not know where the fault that has caused the high
attenuation is within the last 100m. So we need to go back to a point half way.
Remember that going towards the generator is a negative distance. The diagram
below explains the method.
From this we know that the fault lies between #02 and #04 as the attenuation
between #03 and #04 is back to the normal value.
If GPS is being used, remember to enter a minus for the distance (GPS has no
concept of direction). If chainage is being used, just enter the chainage (no sign).
Chainage inherently works out the position correctly.
But what is the attenuation value between #02 and #04? To see this we need to
look at the graphs in more detail. Choose the attenuation graph.
The graph on the left shows attenuation as the points were gathered (sequenced
in time). The graph on the right shows the points sequenced for chainage. To
switch between the two, press