Leaders in Pipeline Survey Systems
4 - 9
OPERATING MANUAL
Use the ‘#’ arrow keys to choose a section. As we can see the attenuation
between #02 and #04 is 19.25 mB/m.
Clear the memory and run the demo again. This time do not use GPS and enter
distances manually using negative distances and see how the graphs change.
4.7 Notes on Graphs
It is inconvenient to have to store a point to view the graphs of a survey. There is
another way, however, using the BROWSE mode.
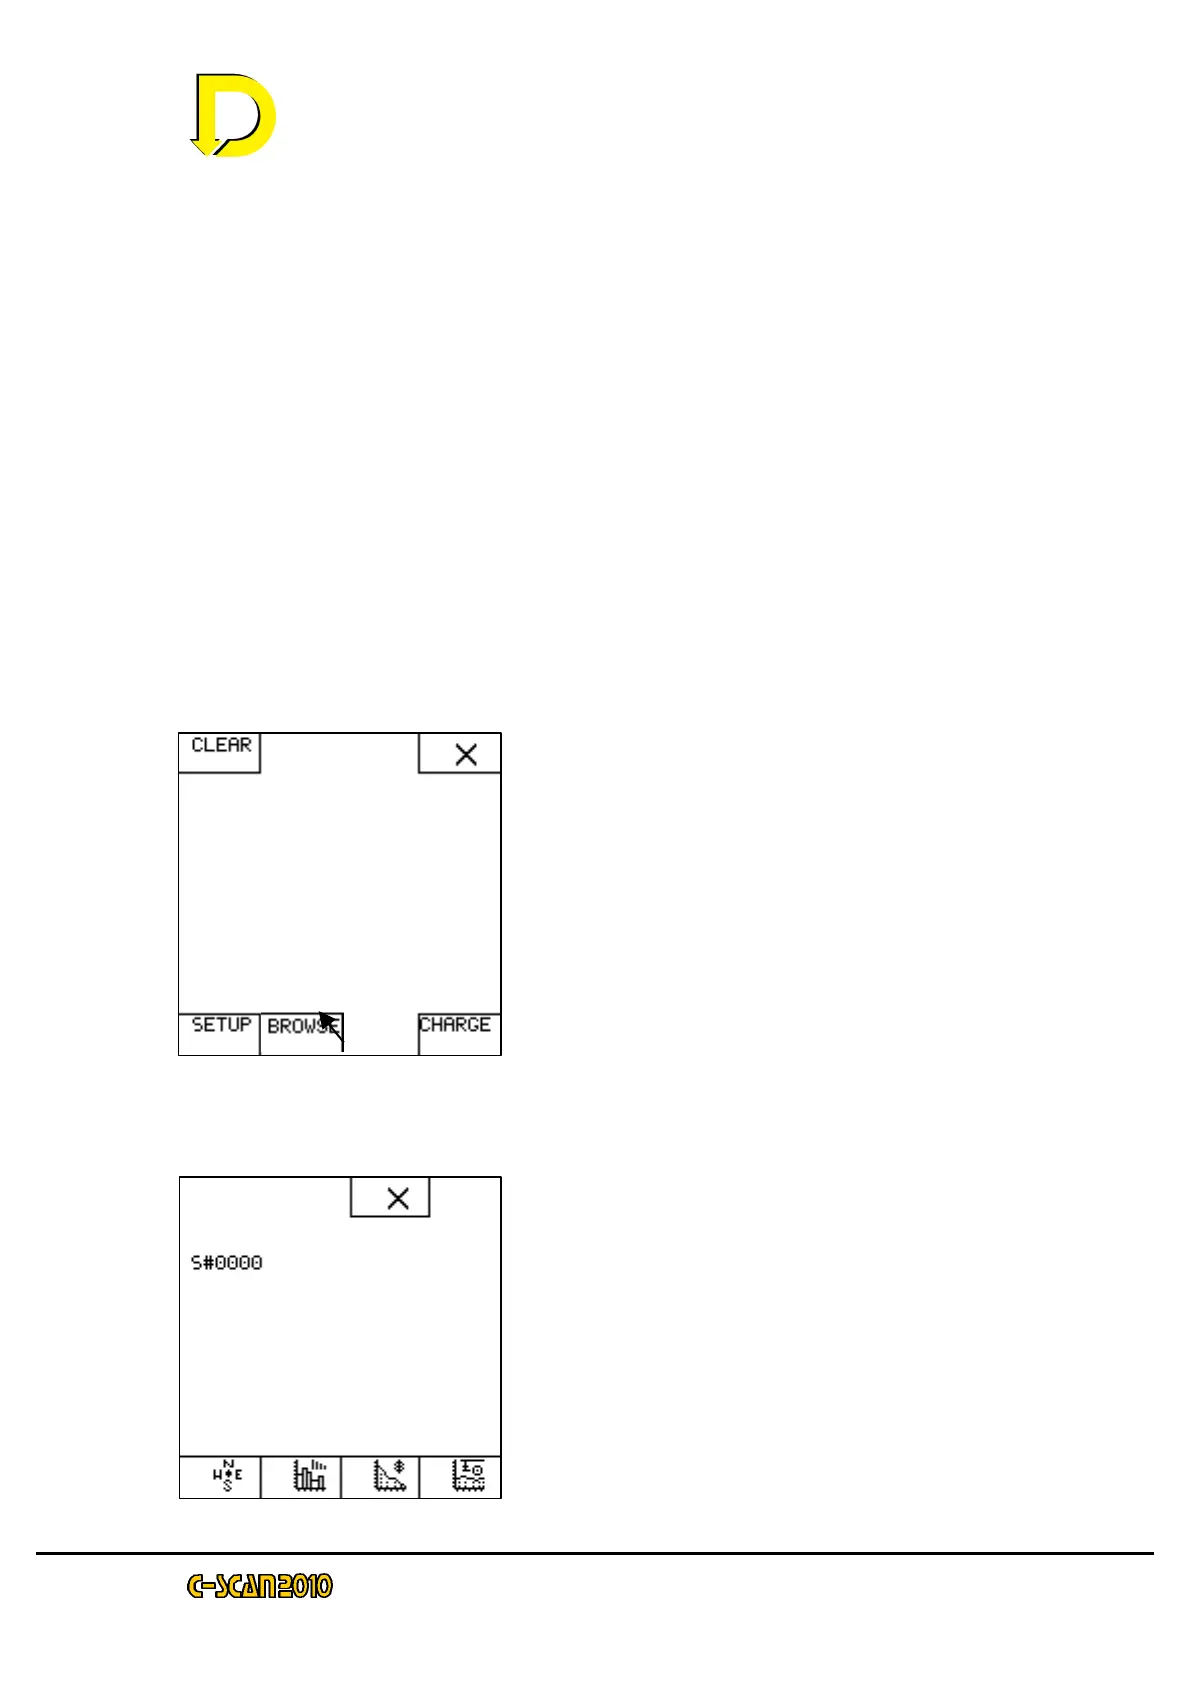
From the start screen press MENU. If a survey is in progress or a previous
survey has been started (there is data in the memory), the menu screen will
display:
NOTE: The BROWSE key only appears as available if the memory is not empty.
Press the BROWSE key and the following screen appears:
Use the arrow keys to select which survey to
display, then press the tick. The following
screens are the same as graph selection during a
survey.