Batch Readings Graph
By selecting Batch/Review Batch/Batch Graph the user can review
all readings in the selected batch as a graph.
Up to five horizontal axes can be displayed representing different
values / statistics as follows:
?Highest reading in the batch “ ”
?Lowest reading in the batch “ ” (for batches of more than one reading)
?Mean of readings in the batch “ ” (for batches of more than one reading)
?High limit for the batch “ ”(when enabled)
?Low limit for the batch “ ”(when enabled)
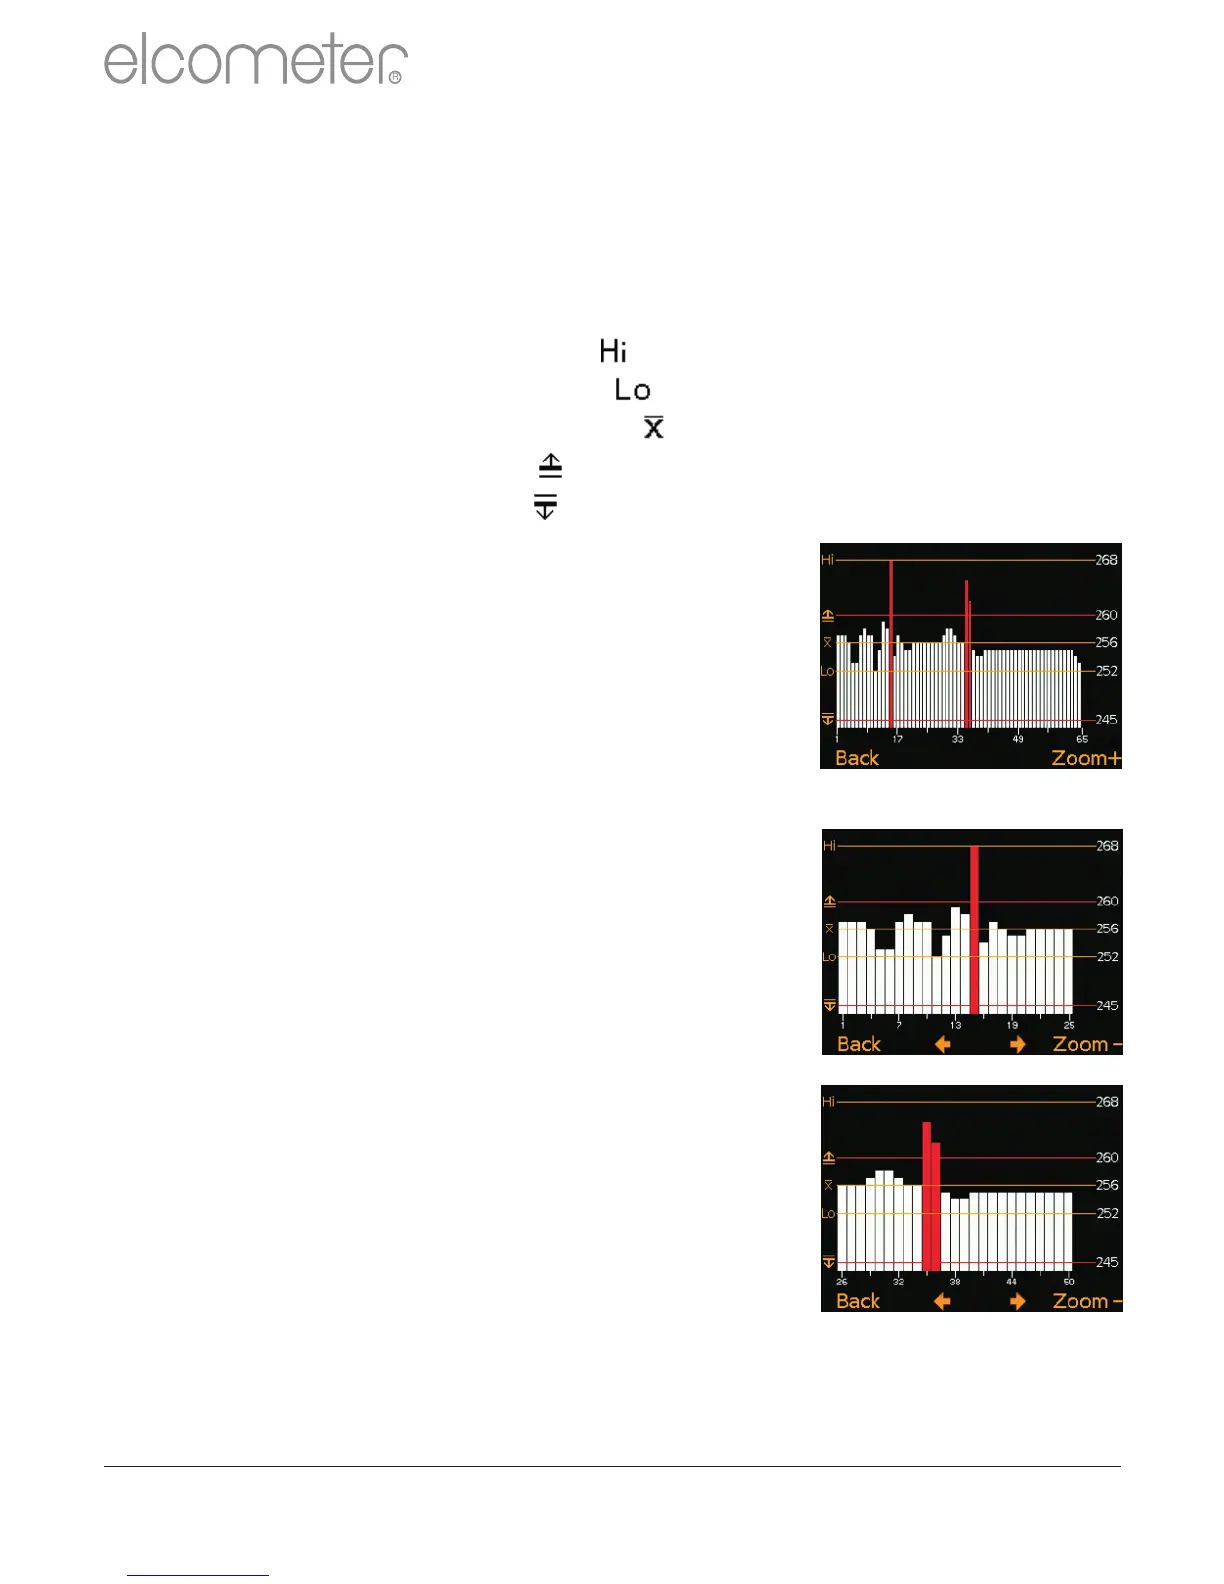
The readings are displayed as white or red vertical
bars; white if a reading is within limits (or no limits
have been set), and red if outside set limits.
If there are more readings in the batch than can be
displayed on a single screen, multiple readings
will be combined into one bar. Should a single
reading within the ‘combined bar’ be outside the
enabled limits, the whole bar will be red.
Pessing the Zoom+ softkey, allows each
individual reading to be displayed, thereby
showing the individual readings outside the
limits.
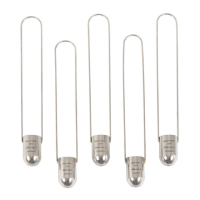
When zoomed in, the graph will always display
the first 25 readings. Pressing the ç softkey
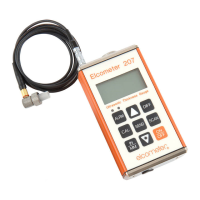
will display the last 25 readings taken.
Subsequent presses of the ç softkey will
scroll backwards, pressing the è softkey will
scroll forwards through the readings, 25
readings at a time.
Pressing the Zoom- softkey returns to the
original overview graph of all readings in the
batch.
To return the gauge to the Batch Review menu,
press the Back softkey.
www.elcometer.com
23
en
R