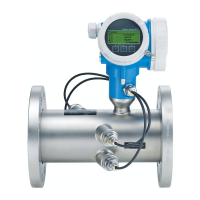
Operation Prosonic T
20 Endress+Hauser
5.1.2 Display appearance
In the measured value display, the bargraph corresponds to the output.
The bargraph is segmented in 10 bars. Each completely filled bar represents a change of 10% of the
adjusted span.
5.1.3 Display symbols
The following table describes the symbols that appear on the liquid crystal display:
measured value display
1. label
2. symbol
3. value
4. bargraph
5. unit
6. position in menu
group selection
1. selection list
Function with free parameter
1. label
2. help texts
3. position in menu
envelope curve
1. envelope curve
Sybmol Meaning
ALARM_SYMBOL
This alarm symbol appears when the instrument is in an alarm state. If the symbol flashes, this indicates a
warning.
LOCK_SYMBOL
This lock symbol appears when the instrument is locked, i.e. if no input is possible.

 Loading...