182
Alert Setting
(mg/dL)
Confirmed
Event Detection
Rate
Missed
Detection
Rate
True Alert
Rate
False Alert
Rate
Low
Alert
60 89% 11% 77% 23%
70 95% 5% 92% 8%
80 97% 3% 93% 7%
90 98% 2% 93% 7%
High
Alert
120 99% 1% 96% 4%
140 99% 1% 94% 6%
180 99% 1% 93% 7%
200 98% 2% 94% 6%
220 98% 2% 94% 6%
240 99% 1% 94% 6%
300 95% 5% 92% 8%
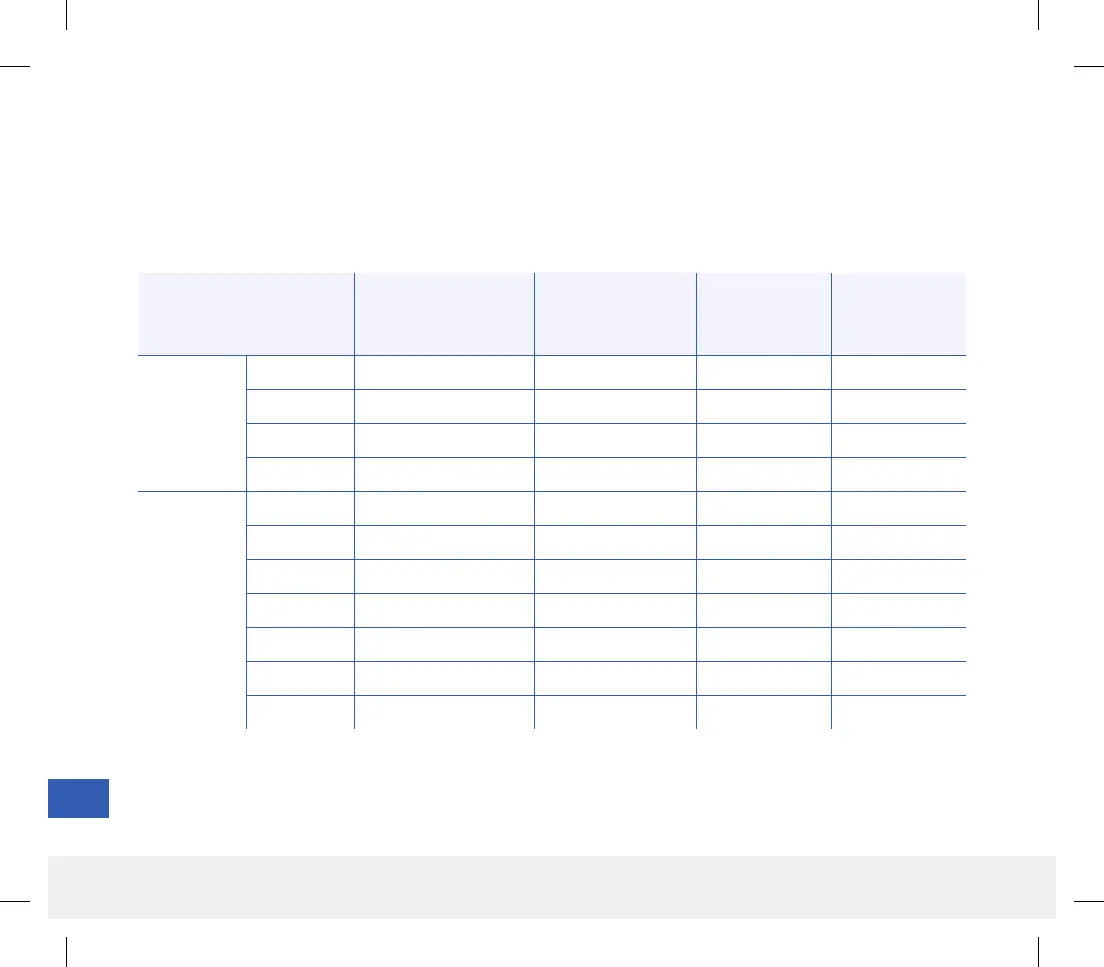
Table 12 – Eversense High, Low, and Predictive Alert Performance (Threshold and Predictive) in the
PRECISION Study
The table below shows an assessment of the ability of the Eversense CGM System to detect high, low, and predictive
high and low alerts, and assess true positive alerts vs false positive alerts. These are shown as a percentage of alerts
provided compared to the YSI reference values at various thresholds.
LBL-1602-01-001 Rev N_Eversense User Guide_mgdL_R1.indd 182LBL-1602-01-001 Rev N_Eversense User Guide_mgdL_R1.indd 182 2/26/20 12:59 PM2/26/20 12:59 PM