183
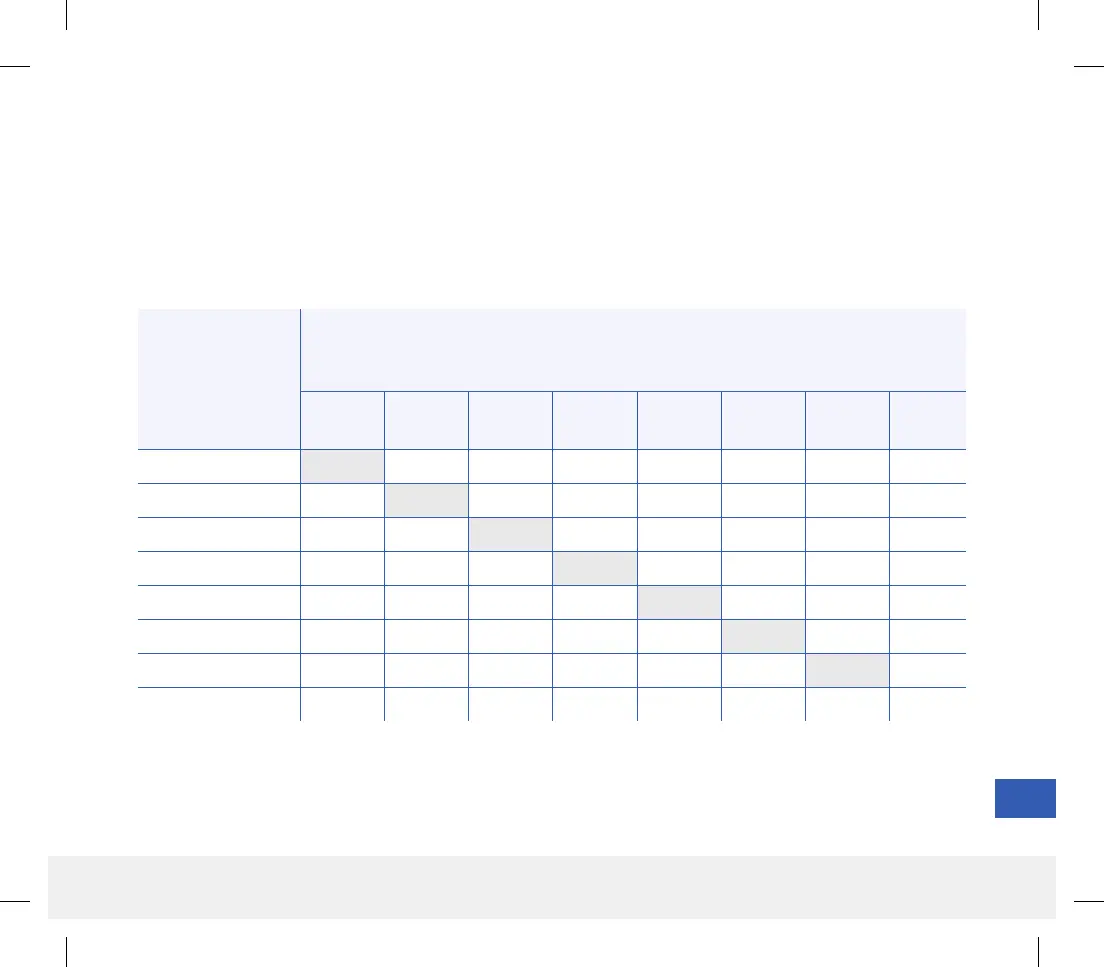
Table 13 – Eversense Rate of Change Trend Agreement in the PRECISION Study
Reference Rate of Change (mg/dL/min)
Percent of Matched Pairs in Each Reference
Trend Range for Each CGM ROC Range
CGM Trend
(mg/dL/min)
< -3 [-3, -2) [-2, -1) [-1, 1] (1, 2] (2, 3] > 3 Total
< -3 14% 20% 30% 36% 0% 0% 0% 135
[-3, -2) 5% 12% 38% 44% 1% 1% 0% 338
[-2, -1) 1% 3% 24% 71% 1% 0% 0% 1,115
[-1, 1] 0% 1% 5% 89% 5% 1% 0% 10,655
(1, 2] 0% 0% 1% 55% 35% 8% 1% 997
(2, 3] 0% 0% 2% 36% 41% 18% 4% 354
> 3 0% 1% 0% 25% 35% 30% 10% 175
Total 57 155 990 11,137 1,085 288 57 13,769
Eversense Rate of Change Trend Agreement
The shaded area of the table below shows agreement between the Eversense glucose trends and the YSI reference
trends while glucose is trending at dierent rates (mg/dL per minute). As an example, when glucose is trending at a
rate of between -1 and 1 mg/dL/minute, Eversense glucose trends are in agreement with the reference trends 89% of
the time.
LBL-1602-01-001 Rev N_Eversense User Guide_mgdL_R1.indd 183LBL-1602-01-001 Rev N_Eversense User Guide_mgdL_R1.indd 183 2/26/20 12:59 PM2/26/20 12:59 PM