184
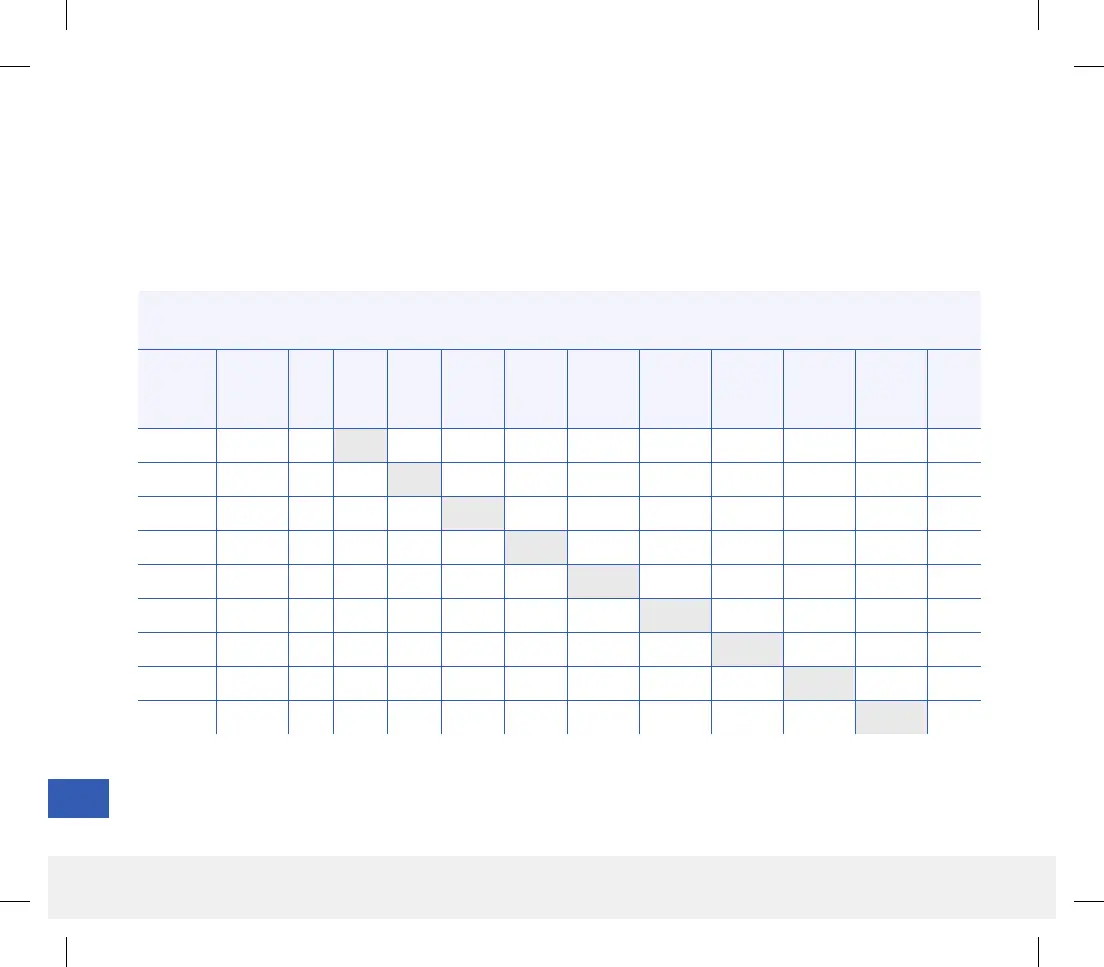
Table 14 – Concurrence with YSI Range All Days in the PRECISION Study
Percent of Matched Pairs in Each YSI Glucose Range for Each CGM Glucose Range
YSI (mg/dL)
CGM
(mg/dL)
Paired
CGM-YSI
(n)
< 40 40-60 61-80 81-120 121-160 161-200 201-250 251-300 301-350 351-400 > 400
40 - 60 1,236 1% 63% 34% 2% 0% 0% 0% 0% 0% 0% 0%
61 - 80 2,003 0% 22% 67% 10% 0% 0% 0% 0% 0% 0% 0%
81 - 120 2,524 0% 2% 17% 71% 10% 0% 0% 0% 0% 0% 0%
121 - 160 2,342 0% 0% 0% 18% 71% 11% 0% 0% 0% 0% 0%
161 - 200 1,727 0% 0% 0% 1% 24% 59% 16% 0% 0% 0% 0%
201 - 250 1,502 0% 0% 0% 0% 1% 19% 65% 14% 1% 0% 0%
251 - 300 1,257 0% 0% 0% 0% 0% 1% 18% 51% 27% 3% 0%
301 - 350 1,628 0% 0% 0% 0% 0% 0% 1% 10% 57% 32% 1%
351 - 400 951 0% 0% 0% 0% 0% 0% 0% 2% 26% 65% 7%
Eversense Concurrence with YSI Values
The shaded areas of the tables below show what percentage of YSI reference values were in the same range as the
sensor glucose values. As an example, when sensor glucose is between 81 and 120 mg/dL, YSI reference values are in
the same range 71% of the time.
LBL-1602-01-001 Rev N_Eversense User Guide_mgdL_R1.indd 184LBL-1602-01-001 Rev N_Eversense User Guide_mgdL_R1.indd 184 2/26/20 12:59 PM2/26/20 12:59 PM