SAIC Exploranium – GR-135 System Manual page: 66
You can use the Average and Points controls
to reduce statistical noise in order
to see a more accurate view of counts and neutron data.
By default, search data is not stored; you have to choose to save search data as part of the setup.
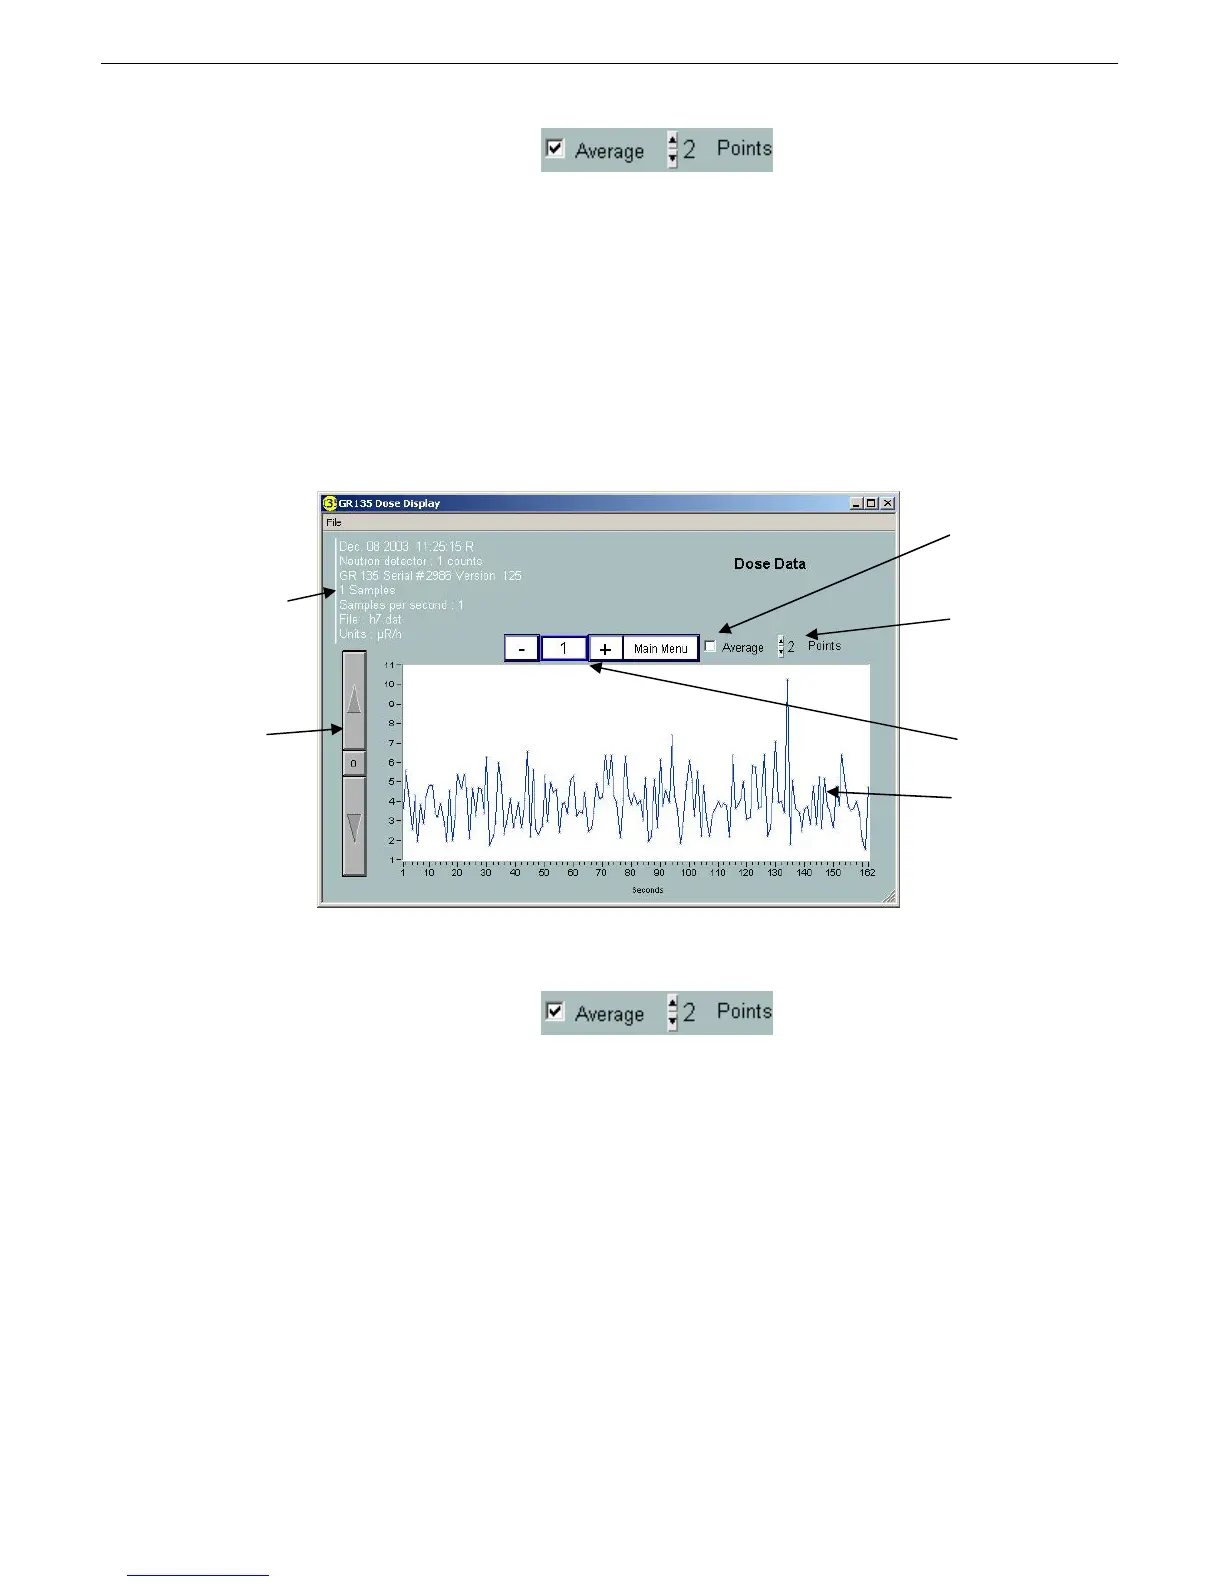
3.6 VIEWING DOSE DATA
Dose data lets you see a replay of how high the actual radiation dose level was for each spectrum. You
can review the dose data history for each spectrum by looking at the chart.
Dose data is calculated based on the full counts for the spectrum (spectra-weighted dose calculation).
You can use the Average and Points controls
to reduce statistical noise in order
to see a more accurate view of dose data.
By default, dose data is not stored; you have to choose to save search data as part of the setup.
3.7 EXPORTING DATA
From the main display you can choose to export spectra, search, and/or dose data to a separate file.
(The box to the right of each export function shows the number of spectra). The exported data is
reformatted and stored under a similar filename with at .txt extension. These data are Live Time
corrected and stored in an ASCII text format that permits direct loading into programs such as Excel as 1
spectra/column. The spectrum data files can be sent as email attachments for viewing on other
computers that are running the IdentiView program. This is the preferred way to send data for further
evaluation. However, data can also be exported to other programs as a text file.
Identifies the GR-135
unit, firmware
version, sample time,
and date and time of
the spectrum. Each
specific has its own
date/time stamp.
Adjust cps scale
Averages the
search data
Sets the average
for the number of
data points
Select file/record
number using -/+
buttons.
Dose data