PQ3470-en-GB_V1.9 10/15
28
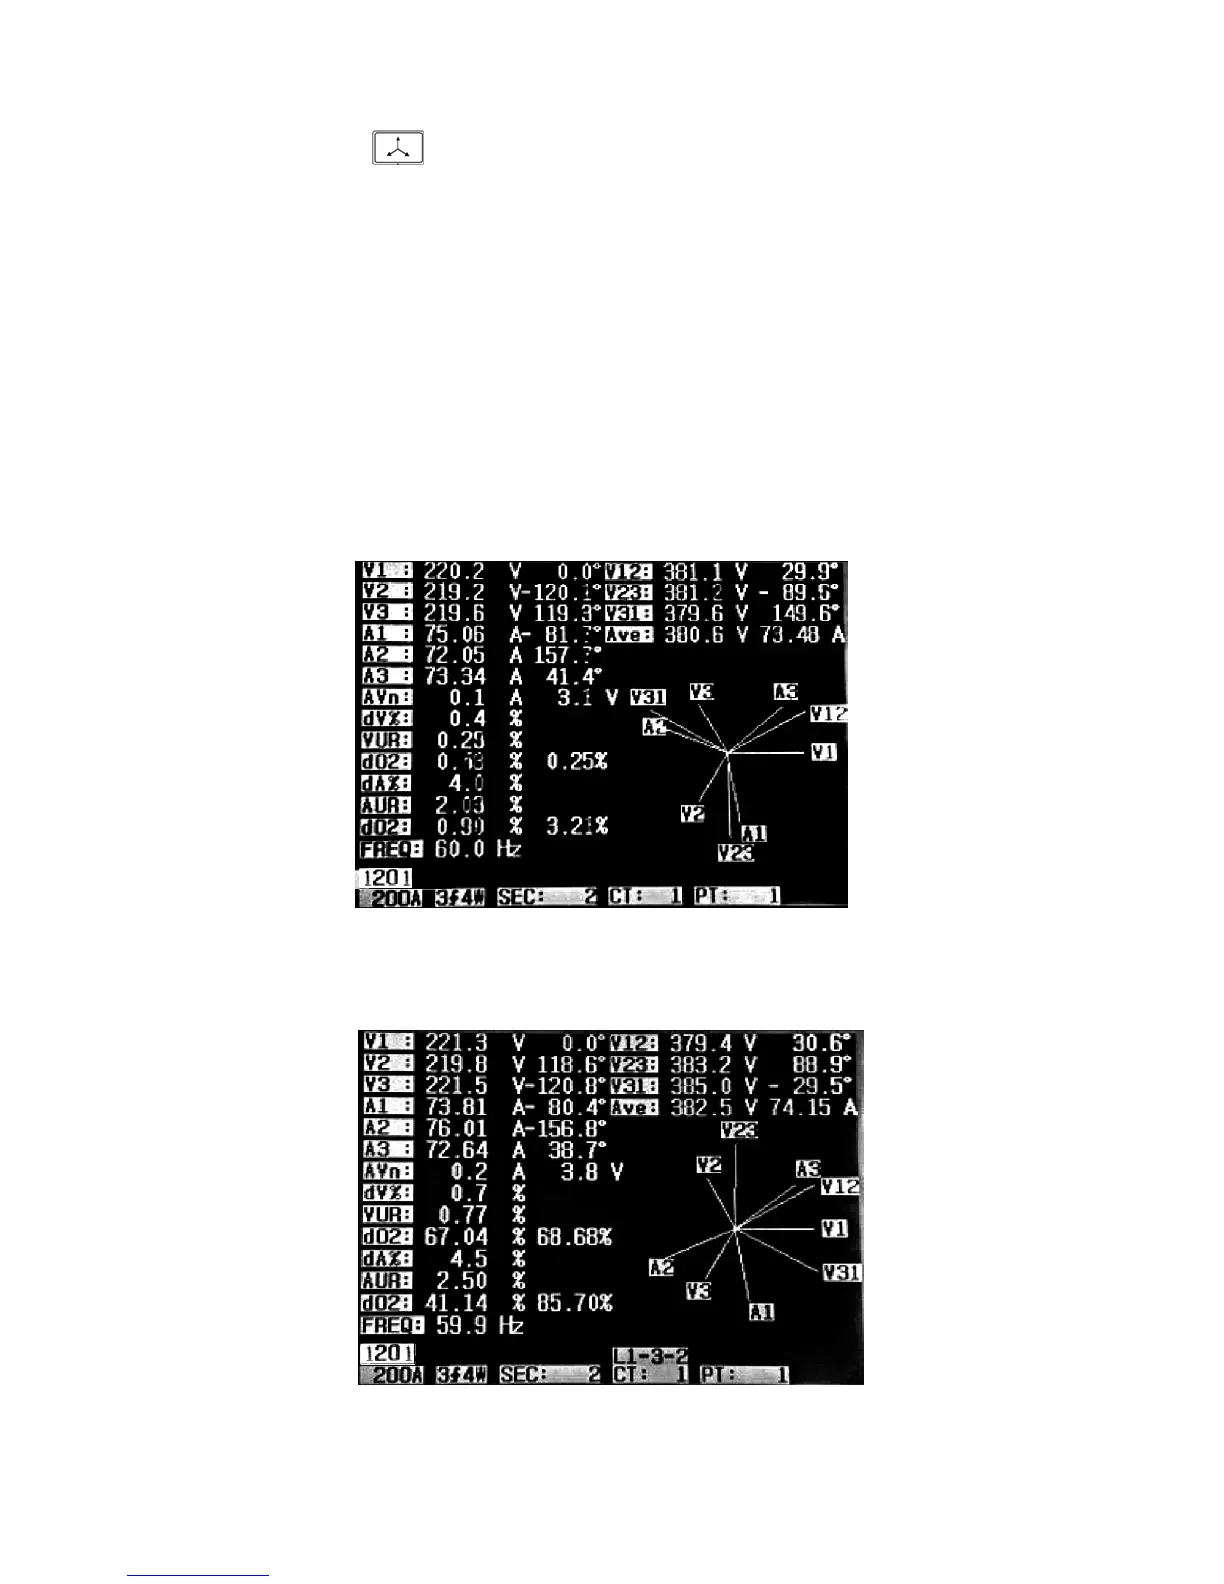
5.8 – Graphic Phasor Diagram
1. Press the Phasor key to display the Phasor as shown in Screen 1 for Figure 5-8a below.
2. Description of Phasor diagram:
V1, V2, V3: Phase voltages in phasor format with respect to V1
A1, A2, A3: Line currents in phasor format with respect to A1.
AVE: Average of the line voltages V12, V23, V31 and the line current A1, A2, and A3
AVn: Calculated voltage and current of the neutral with respect to ground.
dV%: Historical maximum % for MAX (V123) – MIN (V123) / MIN V123) * 100%
VUR: Voltage ratio (unbalanced)
D02 (d0,d2): d0=The first number in the zero sequence unbalanced ratio in % (d0) of
voltage or current. d2=The second number in the negative sequence unbalanced ratio in
% (d2) of voltage or current.
dA%: Historical maximum % for MAX (A123) – MIN (A123) / MIN A123) * 100%
AUR: Current ratio (unbalanced)
Figure 5-8a: Phasor - Screen 1
Figure 5-8b: Phasor - Screen 2