Using The Bushealth Function
Reading the Screen
6
69
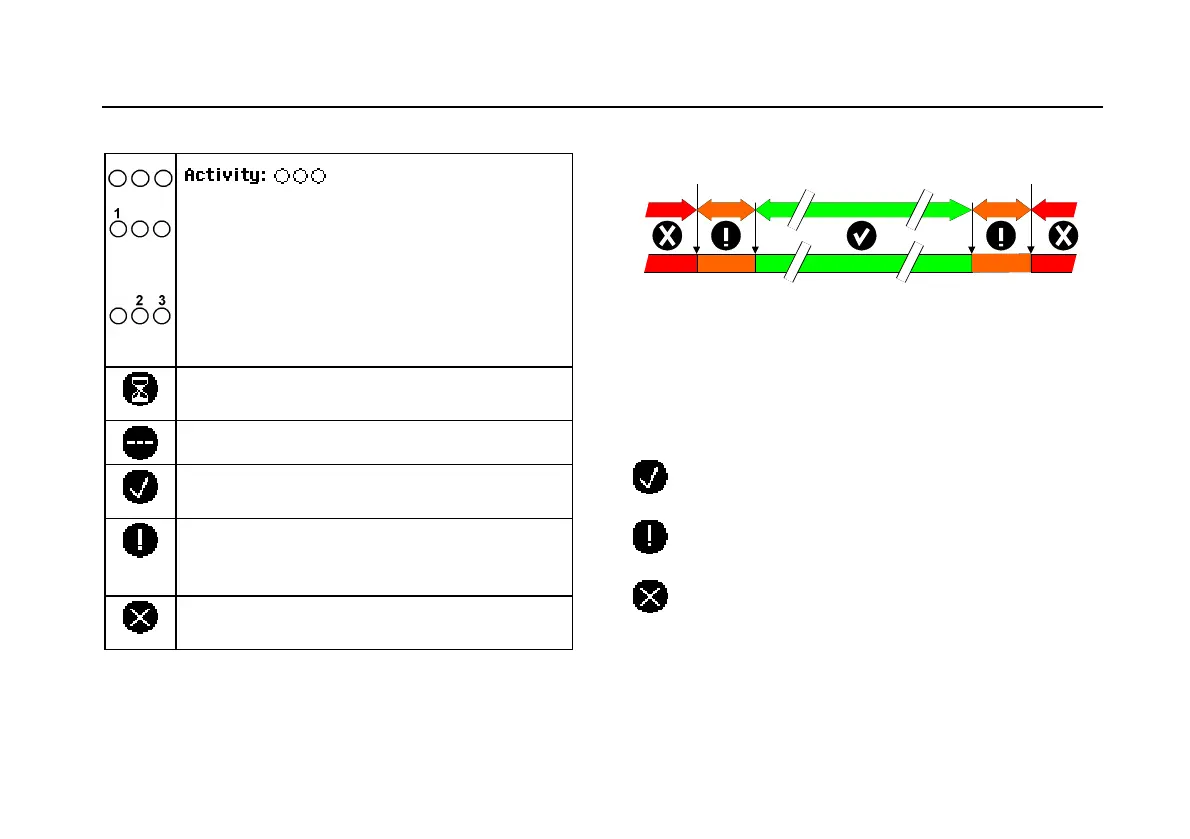
Table 1. Bus Test Screen Indicators
: bus activity indicators.
Bus activity indicator 1:
Q (filled) : voltage measured
{ (open) : no voltage measured
Bus activity indicators 2 and 3:
{ { (both open) : no activity
ÑÑ(blinking) : activity
Busy, the test tool is measuring/processing
data.
No reading available.
Test OK. Measurement results are within 80%
of allowable range, see
Figure 36.
Warning. Measurement results are between
80% and 100% of allowable range, see
Figure
36
Test failed. Measurement results are out of
allowable range, see
Figure 36.
Figure 36 shows the bus health indicator boundaries.
80 %10 % 10 %
GOOD
WEAK WEAK BADBAD
Figure 36. Bus Health Indicator Boundaries
Example:
the high level voltage of a bus must be between +3.0 V
(MIN) and +15.0 V (MAX). Depending on the
measurement result the displayed indicator will be:
If the result is between 4.2 and 13.8V. (10% of
12 V = 1.2 V)
If the result is between 3 V and 4.2 V, or between
13.8 V and 15 V.
If the result is < 3 V or >15 V.