In this Element a black bar starts from the middle of the scale and grows at 0,1 m/s
increments, up to 5 m/s at the top of the scale. When 5 m/s value is reached the black bar
starts to disappear from 0 m/s (middle of the scale) until the top of the scale. When the bar
completely disappears the climbing rate is equal, or above 10 m/s.
The same process occurs when descending, but from the middle of the scale to the
bottom.
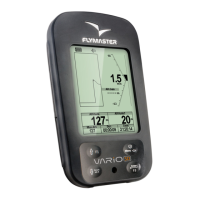
5.1.5 Altitude graph
The Altitude graph element (see Figure. 7) corresponds to a graph altitude versus time.
Altitude is shown in the vertical axis graduated in meters with time shown on the horizontal
axis graduated in seconds.
Figure. 7 Altitude graph element
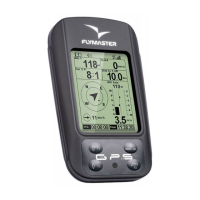
The range of the horizontal axis is fixed and corresponds to 240 seconds (4 minutes),
while the range of the vertical axis is automatically adjusted in order to accommodate the
gained height. In reality the altitude graph element is a plot of the absolute altitude over the
last 4 minutes of flight (see Figure. 8).
Figure. 8 Altitude plot
Document version: 2.0 Page 13