Select the Target Pie Chart mode from the
Floating Menu.
Select Target Pie Chart in Floating Menu to enter.
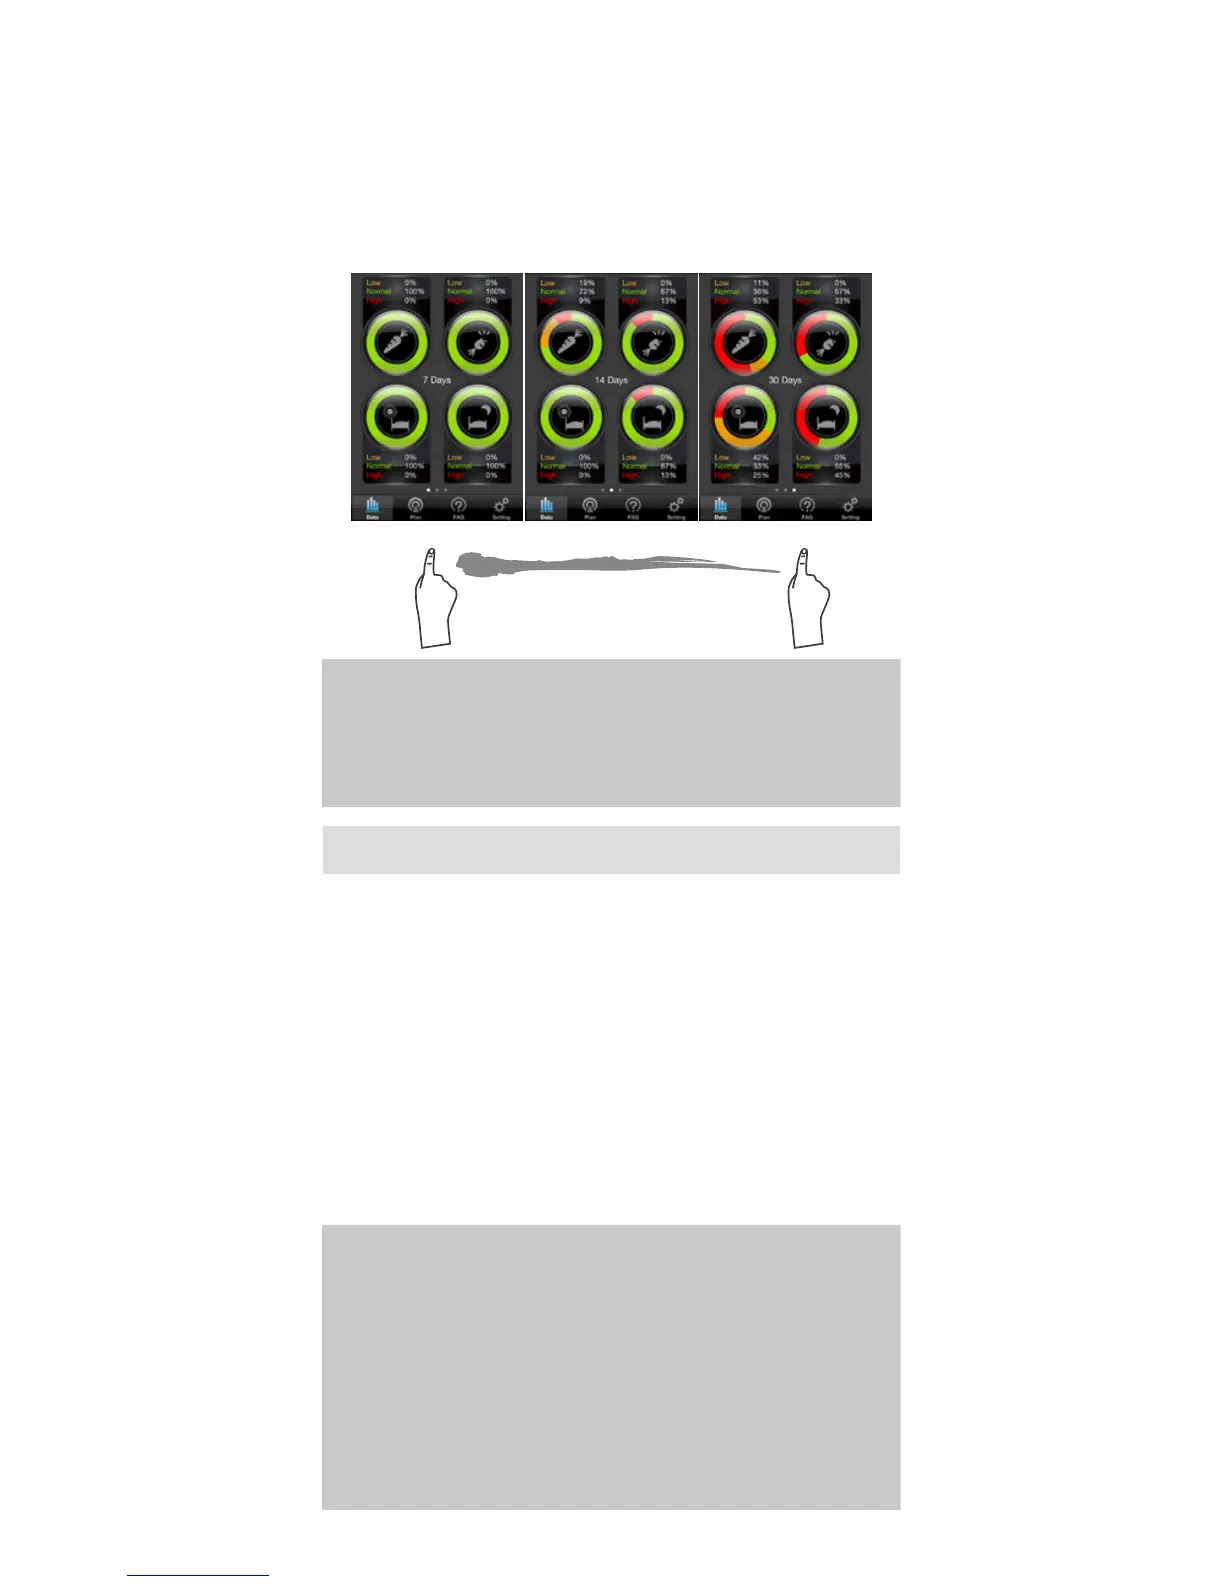
You will see the current 7-Days of glucose control
ratio in percentage under 4 measuring modes.
You can see the percentage in 3 duration times
of current 7-14-30-ays; to quickly switch between,
simply swipe to the left or to the right.
Current 7-, 14-, 30-Days
Color controls:
Green - glucose level is in good control during this time.
Red - glucose level is too high during this time.
Yellow – glucose level is too low during this time.
NOTE:
Do not make treatment decisions based solely
on the information provided by the iFORA App.
All health-related decisions should be made in
conjunction with the advice of a qualied healthcare
provider (HCP). The plan only acts as reference
information for the user’s own necessity and to
acknowledge their monitoring condition over a
certain period of time.
The Plan feature is designed to inform the user
of their recent self-monitoring and self-assessing
results in average percentage over a period of time.
It includes: Personal Monitoring, Diet, Exercise and
Prescription taken. If the user maintains a healthy
diet, regular exercise routine, good medication
intake and active blood glucose monitoring then
the result will appear as the user has achieved
their target goal and have a healthy blood glucose
monitoring during this period of time in average
percentage.
PLAN