Device Status Reports
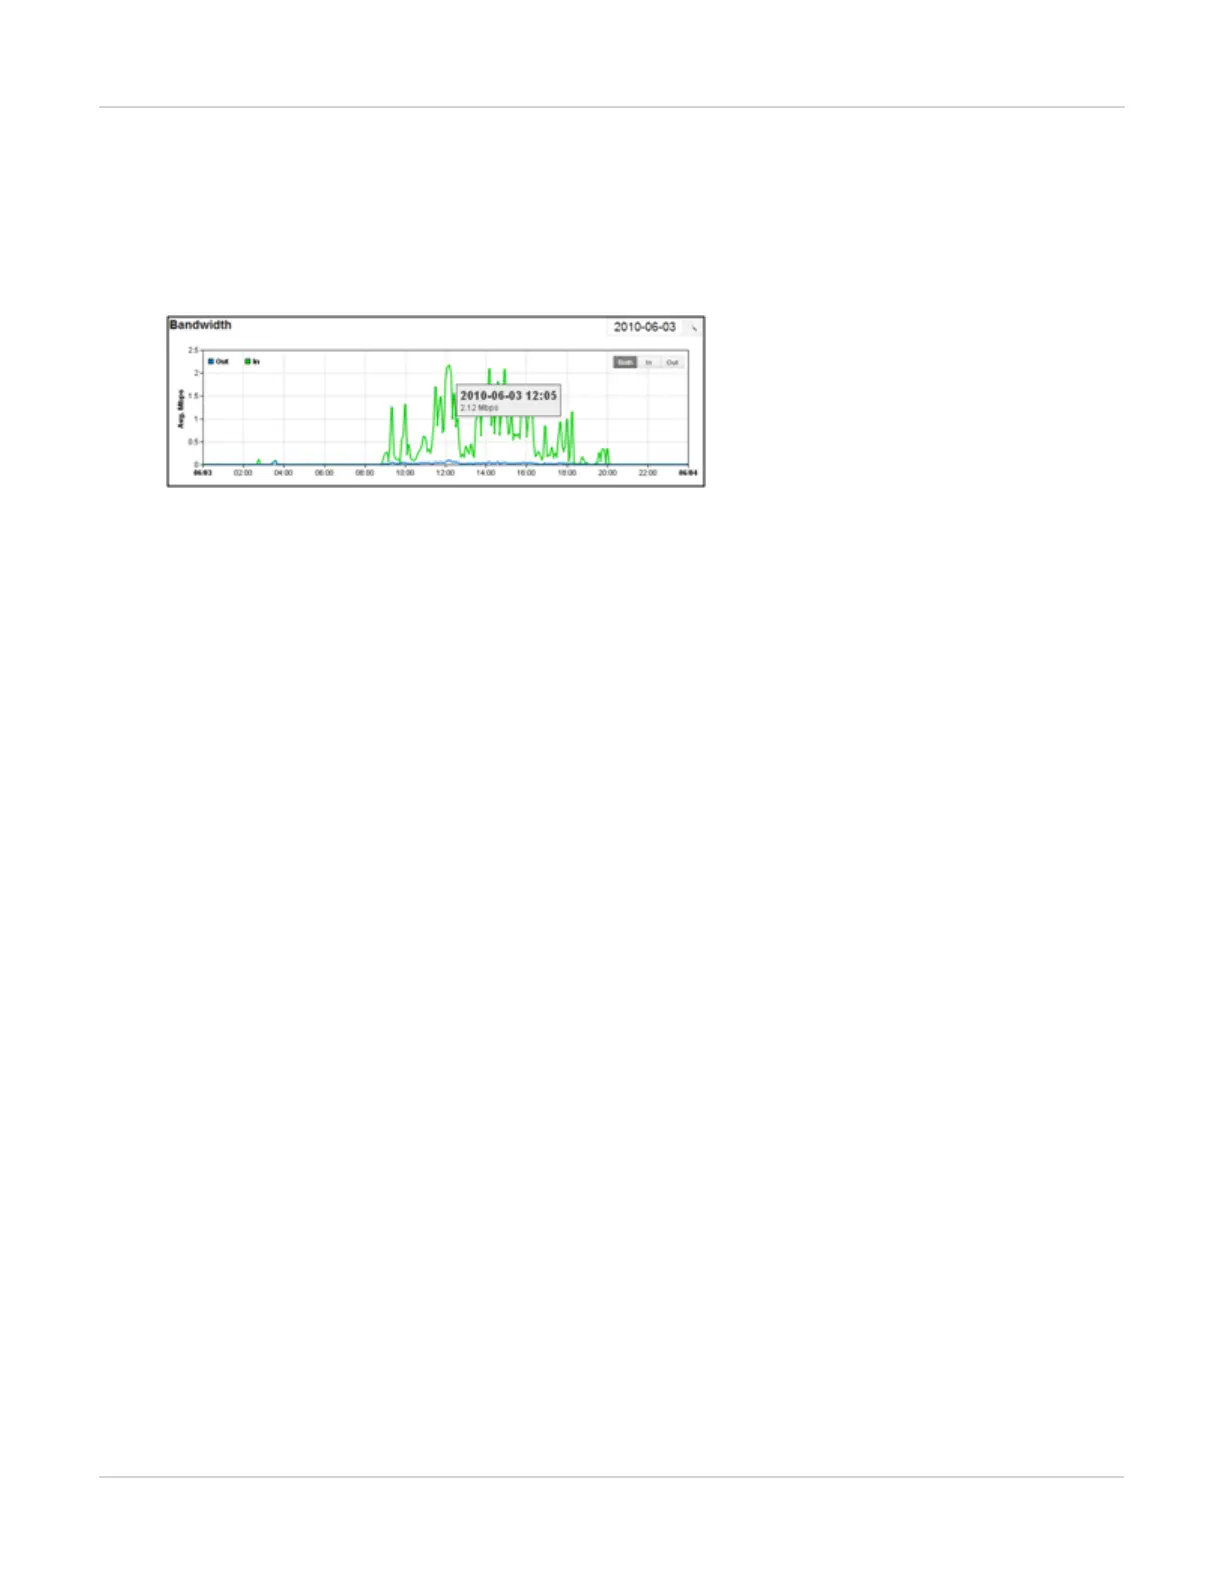
l Clicking on Both, In or Out buttons at the right upper corner of the graph allows you to see bandwidth distribution in
different directions:
l Both: Displays both inbound and outbound bandwidth distribution.
l In: Displays only inbound bandwidth distribution.
l Out: Displays only outbound bandwidth distribution.
l Moving the mouse over the graph will display time, date and corresponding traffic distribution (as shown below):
Statistics Table:
l Lists the average inbound and outbound traffic rate distributed by the date range defined. This is the numerical
presentation of the same information in the Bandwidth Distribution Charts.
l Time: Time periods or dates if a date range is defined.
l Inbound bps: Traffic originating from outside of FortiWAN, going into the internal port.
l Outbound bps: Traffic originating from inside of FortiWAN, going to the external port.
CPU
The CPU report shows the distribution of CPU usage of FortiWAN by the date range defined. CPU usage is a measure
of how much traffic is being managed or how much services the FortiWAN is required to do on that traffic. Sustained
usage near 80% is a good indicator that a larger FortiWAN model is required to handle the required traffic and services
load. Use this chart to compare your target maximum usage with the actual usage over time.
Create a report for a specific day or over a range of dates (See "Create a Report").
Export reports and send reports through email (See "Export and Email").
CPU Usage Distribution
l X axis: Time between 00:00 to 23:59 (of a selected date). Days from start to end if Date Range specified (max 90
days).
l Y axis: CPU usage in %.
l Moving the mouse over the graph will display time, date and corresponding CPU usage in percentage.
Statistics Table
l Lists the CPU usage distributed in percentage (%) by the date range defined. This is the numerical presentation of
the same information in the CPU Usage Distribution Charts.
l Time: Time periods or dates if a date range is defined.
l % Usage: CPU usage in %.
FortiWAN Handbook
Fortinet Technologies Inc.
275
 Loading...