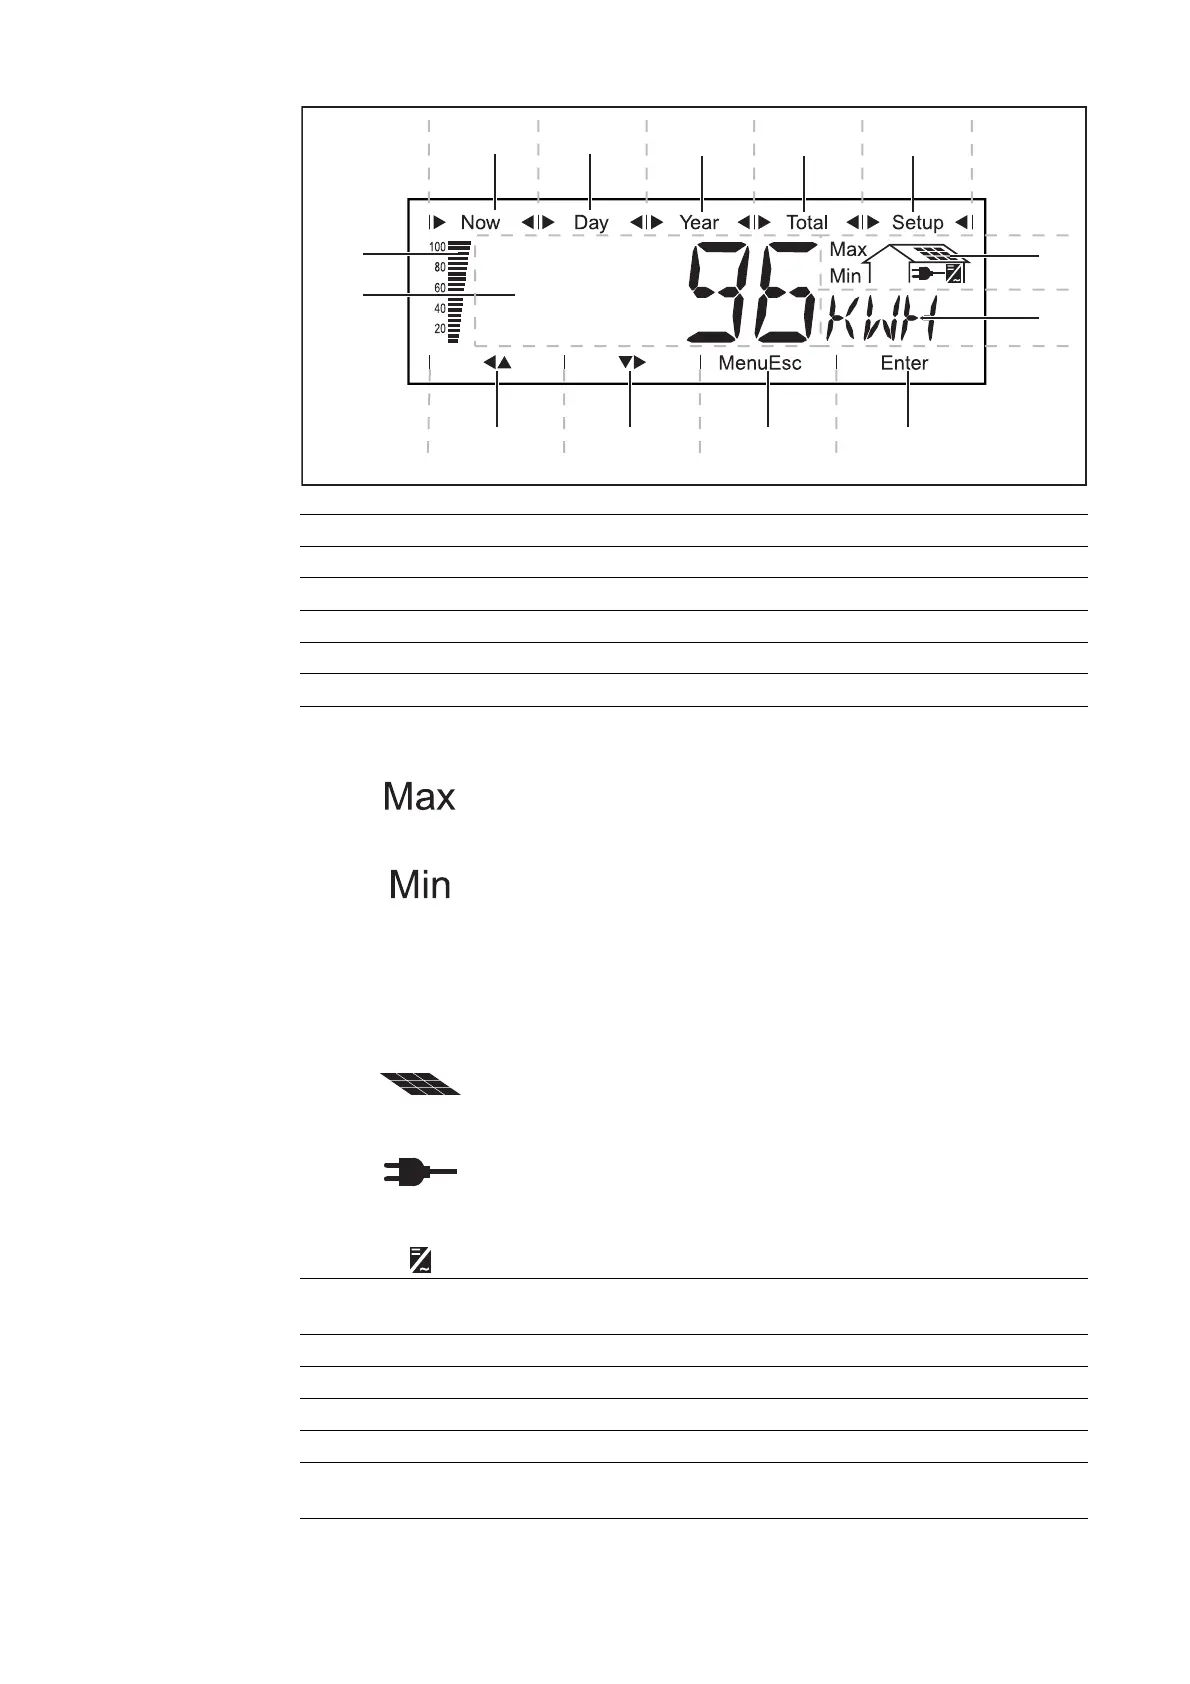
90
Item Function
(1) Icons for the "Now" display mode
(2) Icons for the "Day" display mode
(3) Icons for the "Year" display mode
(4) Icons for the "Total" display mode
(5) Icons for the "Setup" display mode
(6) Icons for operating conditions
The value shown represents the maximum value within the period of
observation (depending on which display mode is selected).
The value shown represents the minimum value within the period of
observation (depending on which display mode is selected).
Important The minimum and maximum values displayed do not rep-
resent the absolute extreme values, because data are recorded only
at two-second intervals.
... appears when values are displayed which are directly associated
with the solar modules
... appears when values are displayed which are directly associated
with the public grid
... appears with data readings that are directly related to the inverter
(7) Range for display unit
for displaying the applicable measuring unit
(8) Icon for the "Enter" key
(9) Icons for the "Menu/Esc" key
(10) Icons for the "Down/Right" key
(11) Icons for the "Left/Up" key
(12) Range for display value
for displaying the value
(11) (10)
(3) (4) (5)
(6)
(7)
(13)
(12)
(9) (8)
(1) (2)