© 2021 Flanders Scientic, Inc.
14
Return to Table of Contents
Function Menu
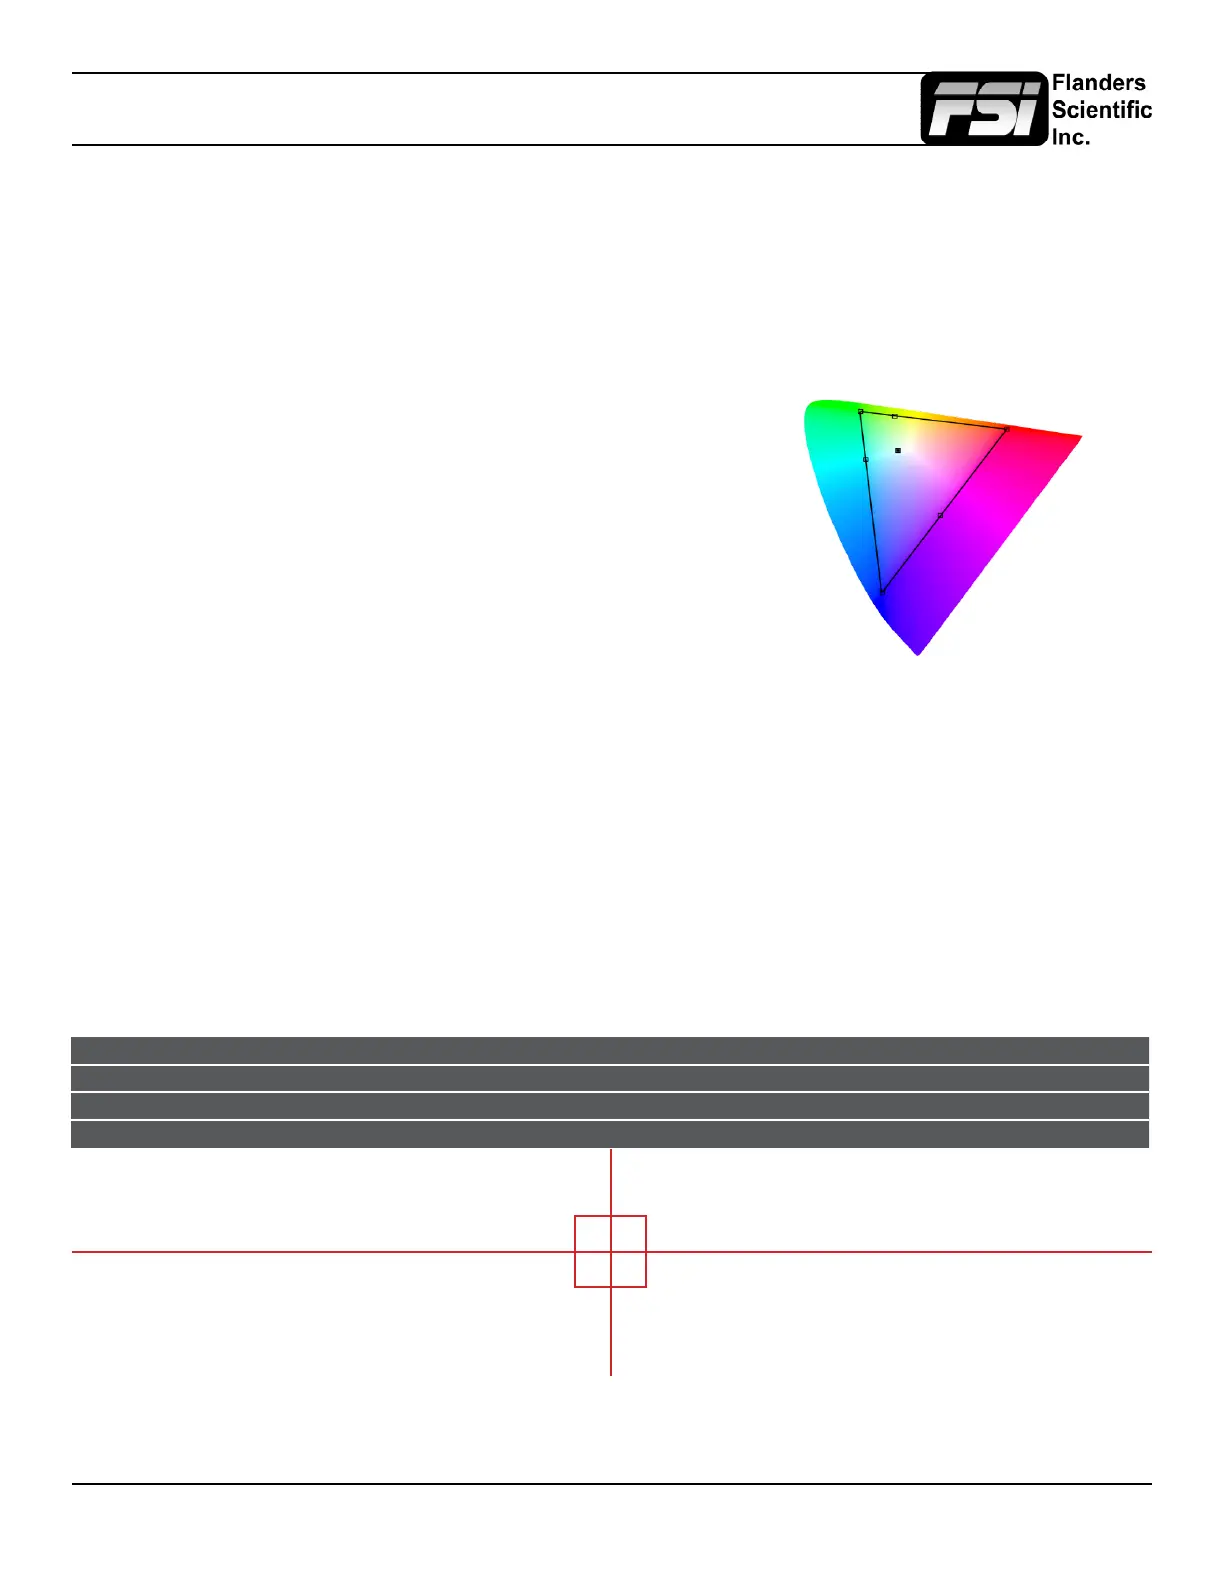
CIE Measurement
This function allows you to get precise real time chromaticity measurements of any point or area within your
incoming signal as well as a real time plot of the measured position on a CIE color space diagram. With the CIE
Measurement function on you can use the H POS and V POS rotary knobs to position your crosshair over the point
within your source that you would like to measure. To reset the vertical or horizontal position of your crosshair back
to center simply press down on the corresponding rotary knob. You may also use the Ref POS rotary knob to select
the size of the sampling area for the measurement data (from a single pixel to a much larger area where the values
will be an average of all pixels within your dened sample area). As you move the crosshair your Measurement data
and plot will update in real time. The CIE Measurement function will provide you with the following data in real time:
• Line and Sample (Identies position of your crosshair)
• R’ (Red signal level percentage normalized to 10 bit data range)
• G’ (Green signal level percentage normalized to 10 bit data range)
• B’ (Blue signal level percentage normalized to 10 bit data range)
• Y% (Luminance level as percentage)
• x (CIE 1931 x chromaticity coordinate)
• y (CIE 1931 y chromaticity coordinate)
• u’ (CIE 1976 u’ chromaticity coordinate)
• v’ (CIE1976 v’ chromaticity coordinate)
• dE2000 (difference between current & reference expressed as dE2000 value)
You can press the Ref POS rotary knob to dene a reference position on screen. Once your reference position is set
it will be indicated on screen by a separate crosshair and you will be able to move the active crosshair to obtain a real
time readout of your current and reference positions as well as a separate readout of the precise difference between
current and reference locations. Please note that your reference position is both a spatial and temporal reference meaning
that the values indicated on screen for the reference are for that point on screen at the moment you set the reference.
Pressing the F Stop rotary knob button allows you to toggle the CIE color space diagram between CIE 1931 and CIE 1976
views. Your chromaticity plots are calculated using signal input data relative to your active Color Space selection on the Color
Management menu. Since your reference color gamut for chromaticity calculation follows this selection it allows you to have
Rec709, DCIP3, EBU, or SMPTE C as your reference color gamut. Please note that if you have the Color Space selection set
to Wide Gamut or a custom USER position the reference gamut used for the CIE Measurement feature will default to Rec709.
The crosshair color will follow the color selected for markers from the Marker Menu. To change the color of the CIE
Measurement function’s crosshair change the Marker color.
CIE Line Sample R’ G’ B’ Y% x y u’ v’ dE2000
Current 542 960 971 0 1 18.93 0.6400 0.3300 0.4507 0.5229
Ref_Pos 541 961 1023 1023 1023 100 0.3127 0.3290 0.1978 0.4683
Diff 1 -1 -52 -1023 -1022 -81.7 0.3273 0.0010 0.2529 0.0546 47.678