Fishnder 400C Owner’s Manual
BasIc operatIon
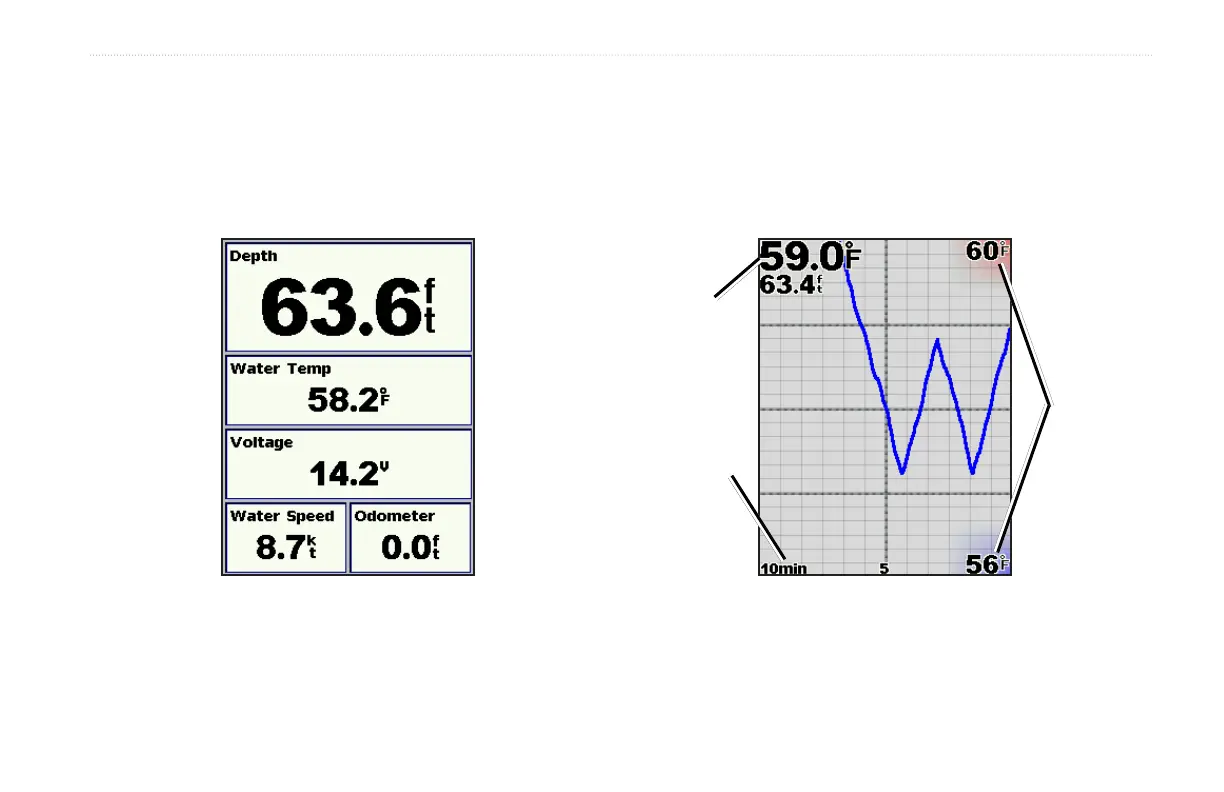
Understanding the Numbers Screen
The Numbers screen shows data elds populated by important
numeric information instead of a graph. The data elds you see are
determined by the capabilities of your transducer.
On the Home screen, highlight Numbers, and press SELECT.
All transducers show depth. If you are using a temperature-capable
transducer, the Water Temp eld appears. If you are using a speed-
capable transducer, the Water Speed and Odometer elds appear.
Understanding the Temp Log Screen
If you are using a temperature-capable transducer, the Temp Log
screen keeps a graphic log of temperature readings over time. The
current temperature and depth are shown in the top left corner.
On the Home screen, highlight Temp Log, and press SELECT.
Temp
range
Time
elapsed
Temp
and
depth
The temperature appears along the right side and the time
elapsed appears along the bottom. The graph scrolls to the left as
information is received.