Chapter 7. Logging Data
150 Transport® Model PT878 Portable Liquid Flowmeter User’s Manual
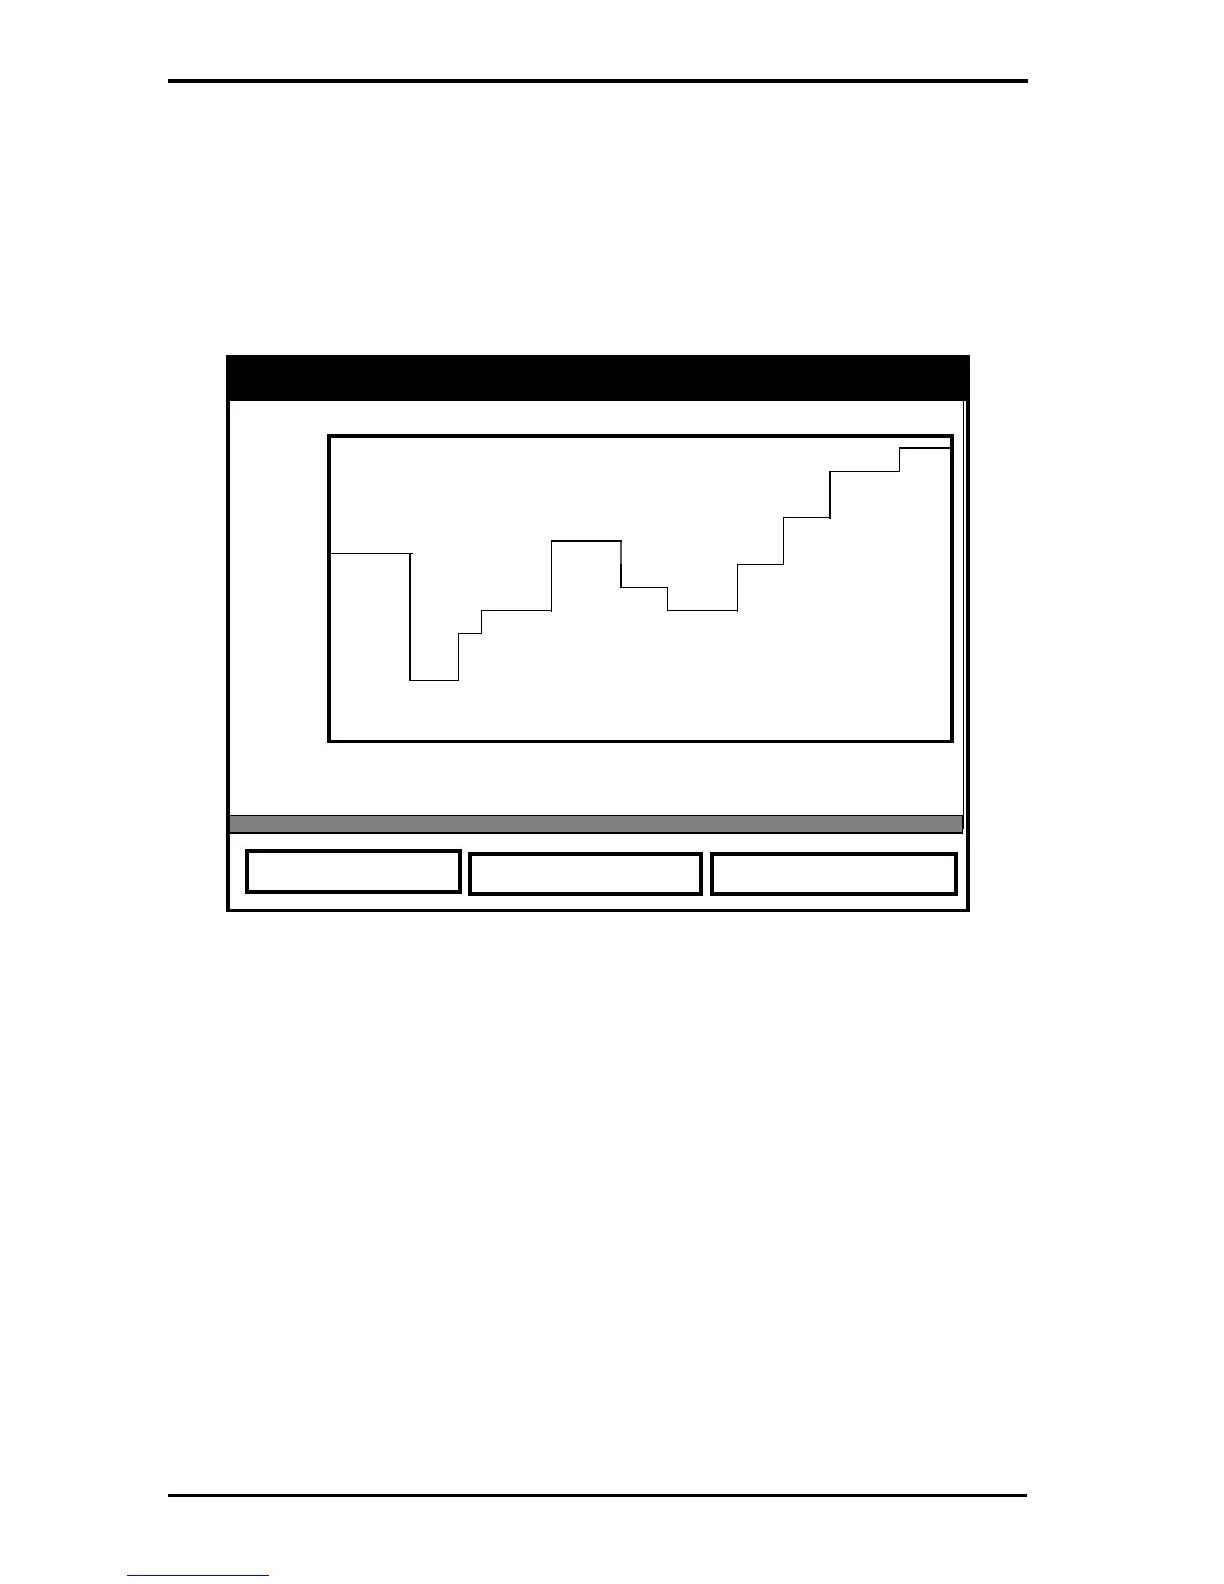
7.5.2 Displaying Log Data in Graphical Form
To view a log in graphical form, be sure the log is highlighted in the left
window of the Log Manager. Then scroll to the View menu and press
[ENTER]. Scroll to the Graph option and press [ENTER].
Figure 100: Log Graph Display Window
The Select Measurement window opens and lists the log measurement
parameters. If a log contains more than one measurement, you must select
which measurement to plot from the list displayed. Once you have chosen
the measurement parameter, press
[F3] (View). The screen now appears
similar to Figure 100 above. (Press
[F2], Cancel, to leave the window
without viewing the graph.)
• If you wish to alter the graph scale, press [F1] (Scale) and go to page 151.
• If you wish to alter the time scale, press [F2] (Time) and go to page 152.
• To leave the window, press [F3] (Exit).
AAA.LOG (Velocity, ft/s)
297
Time Exit
2001/03/01
2001/03/01
13:23:41 PM
13:53:41 PM
289
Scale

 Loading...