Chapter 4: Specifications & Performance Verification
100 2500A Series Operation Manual, 34172 Revision C, March 2008
6. For each frequency listed in the remaining rows of Datasheet 1, the counter should read the entered
frequency ±1 Hz, plus or minus the counter resolution. Ignore all frequencies outside the frequency
range of the unit under test.
4.3.2.2 Spectral Purity Tests
4.3.2.2.1 Description
In this test, the output of the 2500A is connected to a spectrum analyzer. Various frequencies are selected
and the analyzer tuned to determine the presence of either harmonic or non-harmonic (spurious) signals.
4.3.2.2.2 Equipment Required
• Spectrum Analyzer
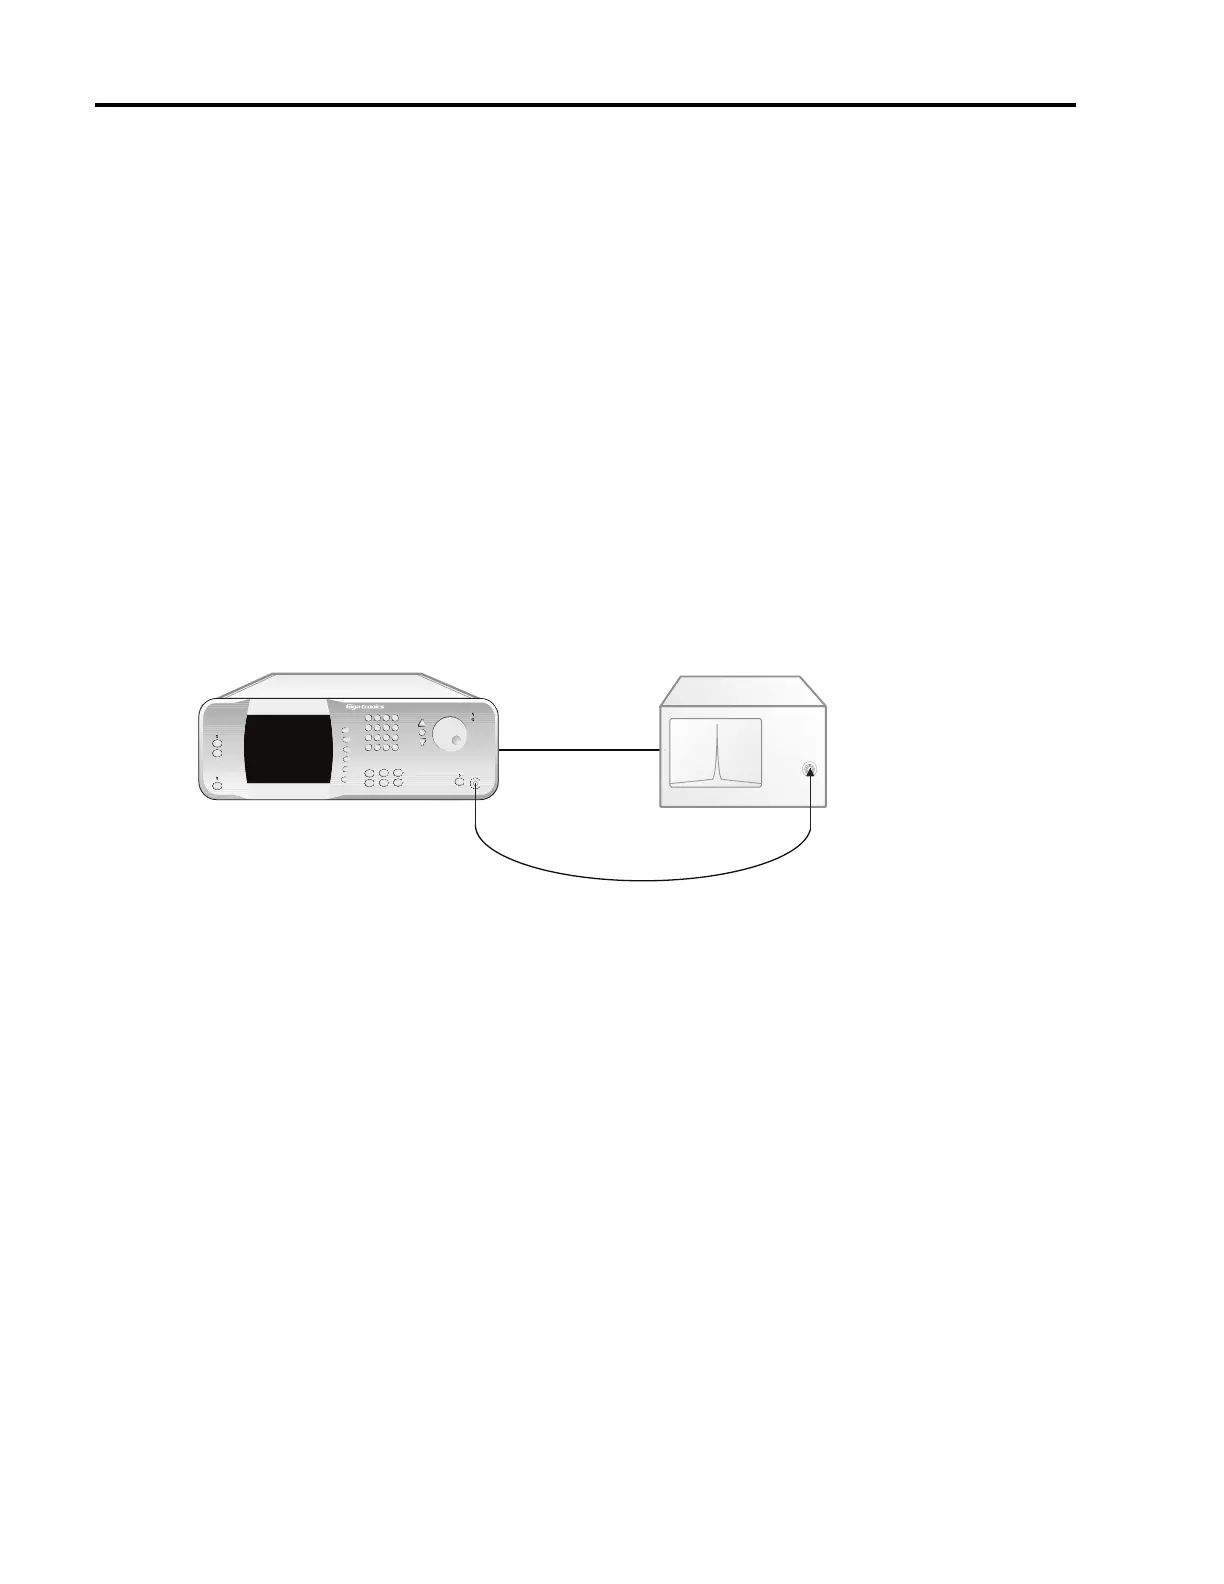
4.3.2.2.3 Test Setup
Figure 4-2: Spectral Purity Tests
4.3.2.2.4 Procedure
1. Connect the equipment as shown in Figure 4-2. Allow the equipment to warm up for at least 30 min-
utes. Set the 2500A to the first test frequency listed in Datasheet 2, and set the RF amplitude to +10
dBm or maximum leveled output (whichever is lower).
2. Press the [RF ON] button to turn on the RF output.
The indicator above the RF ON button is blue when the 2500A output is active.
3. Set the spectrum analyzer to view the 2500A output signal. Adjust the analyzer reference level so
that the peak of the displayed signal is at the top graticule line.
4. Set the spectrum analyzer span to 500 MHz with the signal centered on the screen. Gradually nar-
row the span, keeping the signal centered, to observe any non-harmonically-related or spurious sig-
nals. Use appropriate resolution and video bandwidths to allow sufficient dynamic range. Adjust
center frequency of the spectrum analyzer to the harmonic and subharmonic frequencies of the test
frequency.
MICROWAVE SYNTHESIZER (UUT)
RF IN
Spectrum Analyzer
RF OUT
2500A Microwave Synthesizer
IN Timebase OUT