The contents of the graph as related to an end point type are as follows:
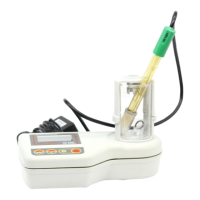
Equivalence End Point (pH): The pH readings and the selected derivative vs. volume of titrant are displayed (see Figure 1).
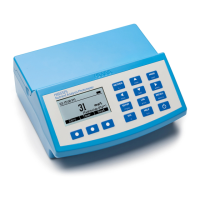
Equivalence End Point (mV): The mV readings and the selected derivative vs. volume of titrant are displayed (see Figure 2).
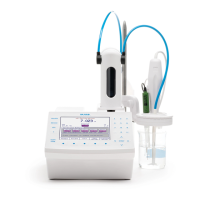
Fixed End Point (pH): The pH readings vs. volume of titrant are displayed (see Figure 3).
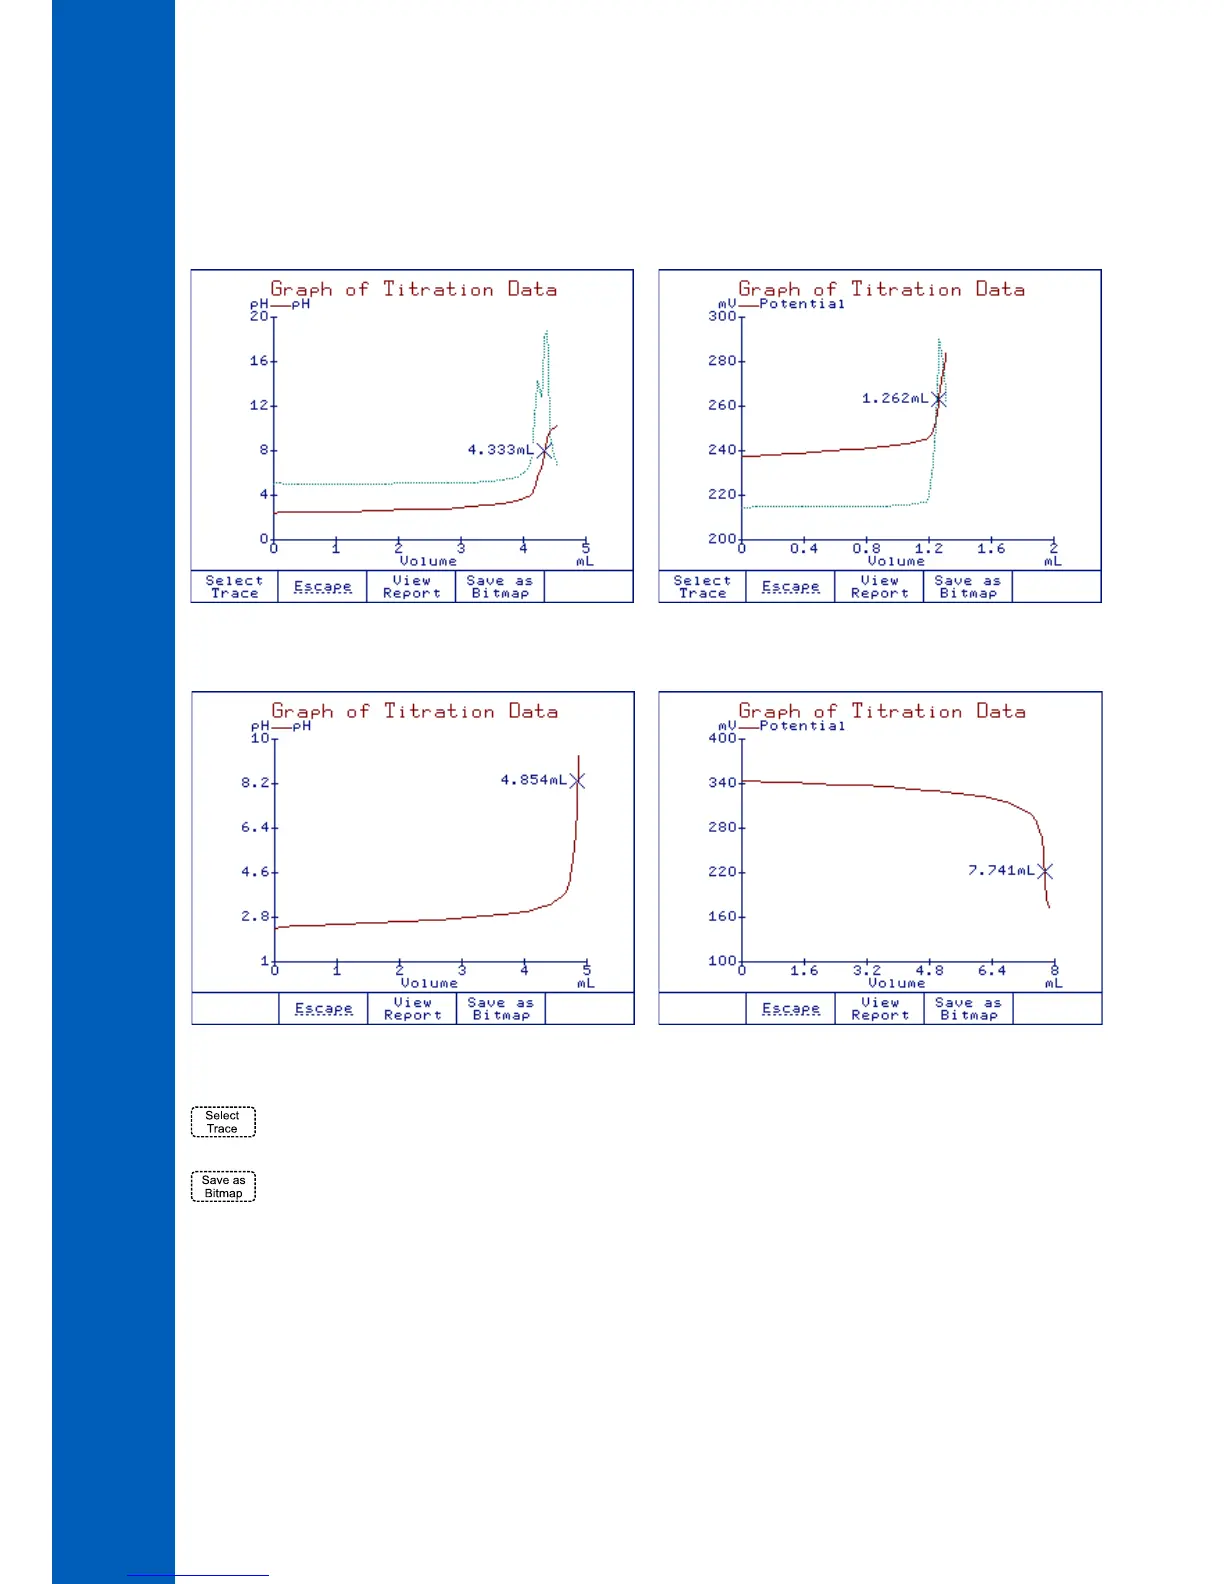
Fixed End Point (mV): The mV readings vs volume of titrant are displayed (see Figure 4).
- Changes the y-axis scale to either the mV (or pH) readings or the selected derivative values (of mV or pH). Available only
for titrations with equivalence end points.
- Allows you to save the graph as a bitmap file. Available only when the titration is finished.
Figure 1
Figure 3
Figure 2
Figure 4
 Loading...