10-4 Statistics aplet
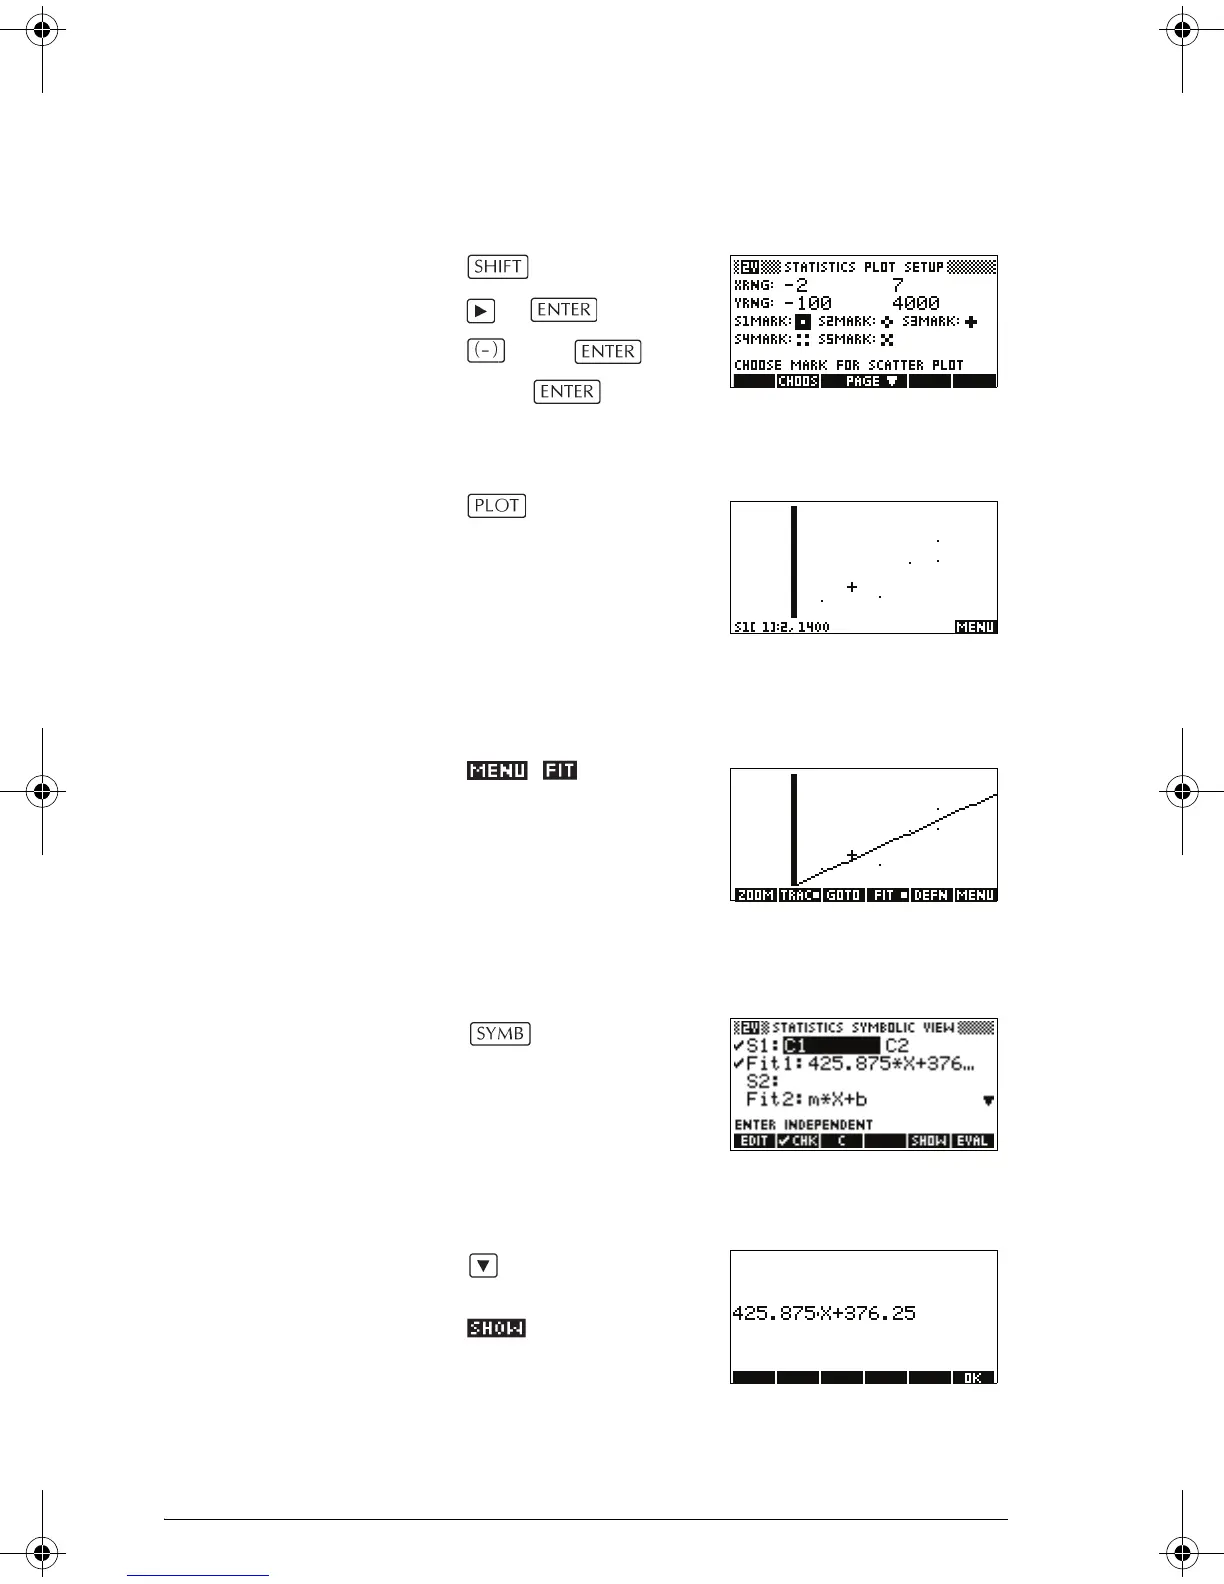
Setup plot 8. Change the plotting range to ensure all the data
points are plotted (and select a different point mark, if
you wish).
SETUP-PLOT
7
100
4000
Plot the graph 9. Plot the graph.
Draw the
regression curve
10.Draw the regression curve (a curve to fit the data
points).
This draws the
regression line for the
best linear fit.
Display the
equation for
best linear fit
11.Return to the Symbolic view.
12.Display the equation for the best linear fit.
to move to the
FIT1 field
The full FIT1
expression is shown.
The slope (m) is 425.875. The y-intercept (b) is
376.25.
HP 39gs English.book Page 4 Wednesday, December 7, 2005 11:24 PM