AFE1_AFE2-1:1
60
Working with I-scope
IAR Debug Probes User Guide
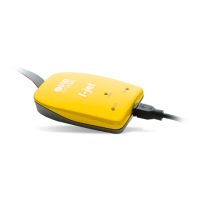
I-jet®, I-jet Trace, and I-scope™
the MCU goes into the high-current mode. For information about the minimum value
for your specific processor, see its data sheet.
To convert the current measurements to the actual power consumed by the MCU,
I-scope automatically measures voltage at the I- terminal of the shunt resistor.
I-scope measures current and voltages at a sampling rate of up to 200 kHz and sends it
to I-jet/I-jet Trace which synchronizes it with the running MCU's program counter (if
available), so it can be displayed in real time and analyzed using C-SPY.
For more information about power debugging using C-SPY, see the C-SPY Debugging
Guide for Arm.
Working with I-scope
SETUP AND INSTALLATION
1
Connect I-scope to I-jet/I-jet Trace using the supplied MIPI-20 cable.
2 Connect the target to I-scope using the MIPI-20 cable that came with I-jet/I-jet Trace.
3 Start IAR Embedded Workbench and select your project.
4 To measure current, connect the I+ and I- leads across the shunt resistor on your board.
The I+ lead should be connected on the higher voltage side, which is the one coming
from the voltage regulator or power supply. If the leads are reversed, the Power graph
in the Timeline window will show current and power equal to 0.
To measure voltage, connect one or more of the I+, V1, V2, and V3 scope channels to
any voltage test points that you want to monitor.
5 From the C-SPY driver menu in IAR Embedded Workbench, choose Power Log
Setup and enter the shunt resistor value in the Power Log Setup window.
6 Start the application. To enable power logging, choose Enable from the context menu
in the Power Log window or from the context menu in the Power Log Graph in the
Timeline window. The power and voltage data shown in the Power graph in the
Timeline window will be displayed in real time while the MCU program is running.
Technical specifications
Reference information about:
● The I-scope package, page 61
● External characteristics, page 61
● I-scope probe specification, page 62