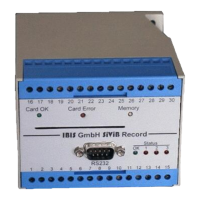
IBIS
GmbH
SiViB
Record 1500 / Record Control Manual Page 39
IBIS
Ingenieurbüro für Instandhaltungs- und Schwingungsmeß-Systeme GmbH
Reinheimer Str. 17, 64846 Groß-Zimmern, Germany; www.ibis-gmbh.de
Tel. +49 6071/42222, Fax +49 6071/71707, Email: info@ibis-gmbh.de
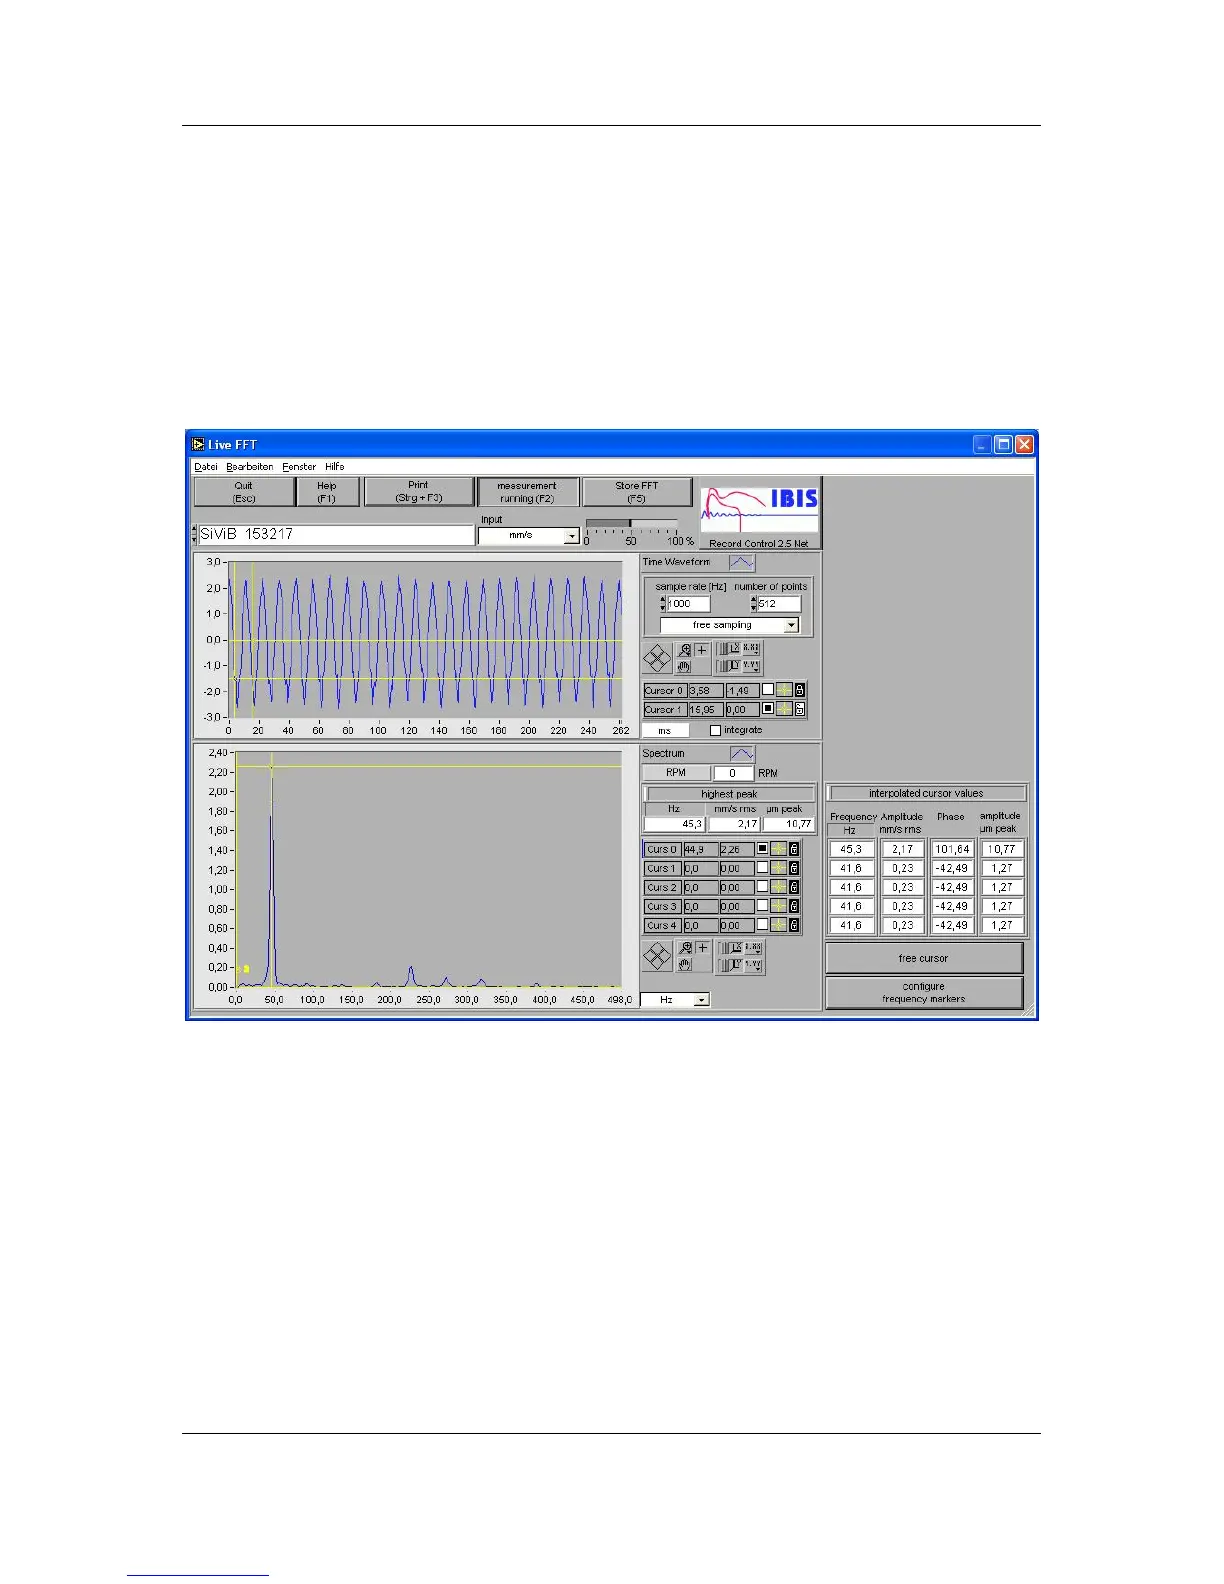
Frequency Spectras
The software version Record Control Pro allows measurement and calculation of time waveforms and
FFT spectras. These options are activated in Soft Control Pro only.
The spectras can be uploaded via memory card (last spectrum) or using a serial link cable. (last
spectrum or live spectrum)
Live Spectrum
Connect the PC to the instrument using a nullmodem cable.
From main screen click Live Display, Live Spectrum.
The data acquisition and upload starts immediately. The software shows the time waveform and the
FFT spectrum as soon as the transfer is completed. The next measurement is then started
automatically.
The button Measurement running / Measurement stopped allows you to stop and freeze the last
reading.
Use the controls sample rate and number of points to set the parameters according to your needs.
You have 5 cursors for identifying frequency and amplitude of interesting lines. A separate table shows
interpolated frequency and amplitude at the cursor positions after interpolation, which can be more
precise for identifying bearing fault frequencies.
If you have a machine speed sensor connected, you can select triggered measurement for getting a
phase reading. Position cursor 0 at the peak of interest and read the corresponding phase.
You can store a FFT by clicking the “Store FFT” button. These FFTs can be reviewed in the Spectrum
Display window, which you can open from the main window.
 Loading...