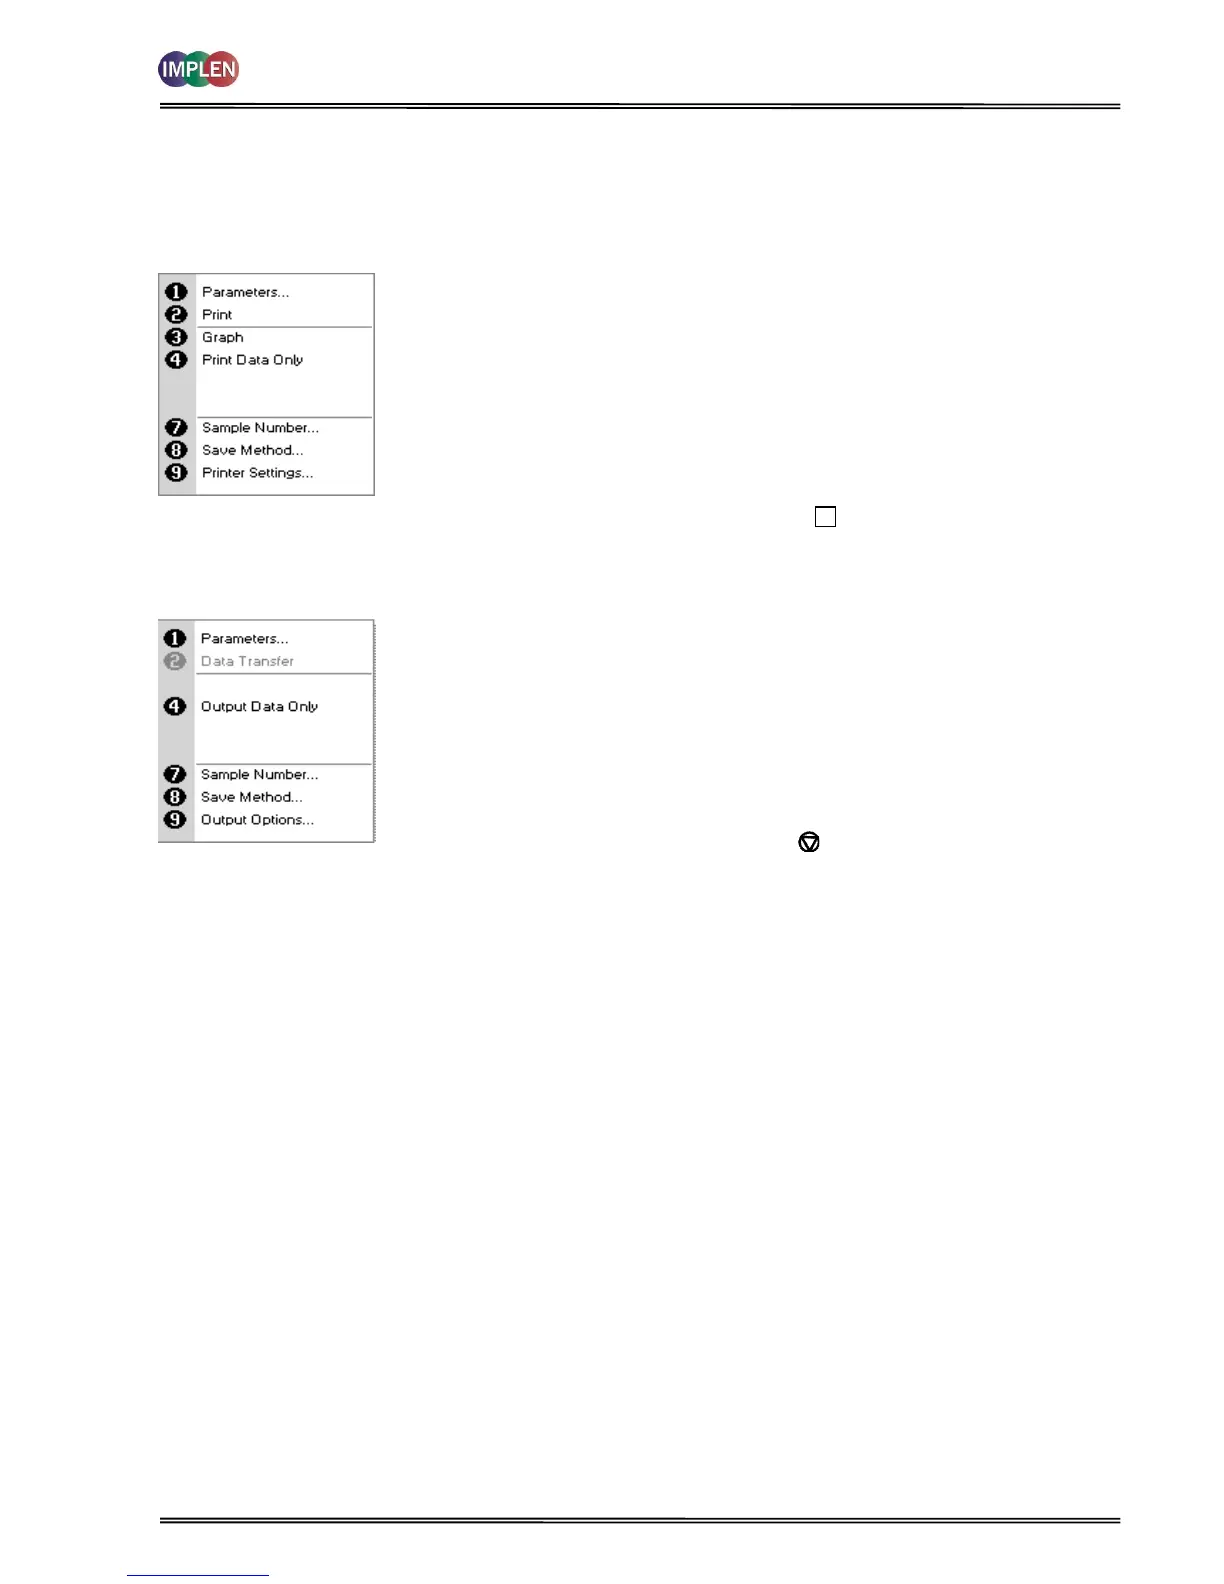
After each measurement the following Options are possible:
1) Return to parameter screen.
2) Print the results via selected method.
3) Toggle graph on/off. Graph shows a wavescan plot across the
range 220 nm to 400 nm (for Dye methods 220 nm to 750 nm)
with cursors denoting 230, 260, 280 and 320 nm
4) Toggle on/off the graph in the print-out or saved file.
7) Define the sample number you wish to start from.
8) Save the parameters as a method.
9) Open printer settings, possibility to change the printer settings
within the method as described in 7.3 Output Options / Printer.
Exit Options by pressing Escape , OR wait
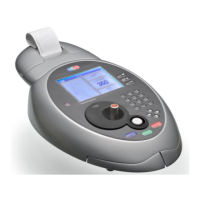
After each measurement the following options are possible in the
Menu:
1) Return to parameter screen.
2) Transfer the results via selected Output Option.
4) Toggle on/off the graph in the print-out or saved file.
7) Define the sample number you wish to start from.
8) Save the parameters as a method.
9) Open Output Options settings, possibility to change the Output
Options settings within the method as described in 7.3 Output
Options / Printer
Exit Menu by pressing Escape