Measuring Ventilation Parameters
44
9
IMT Analytics AG
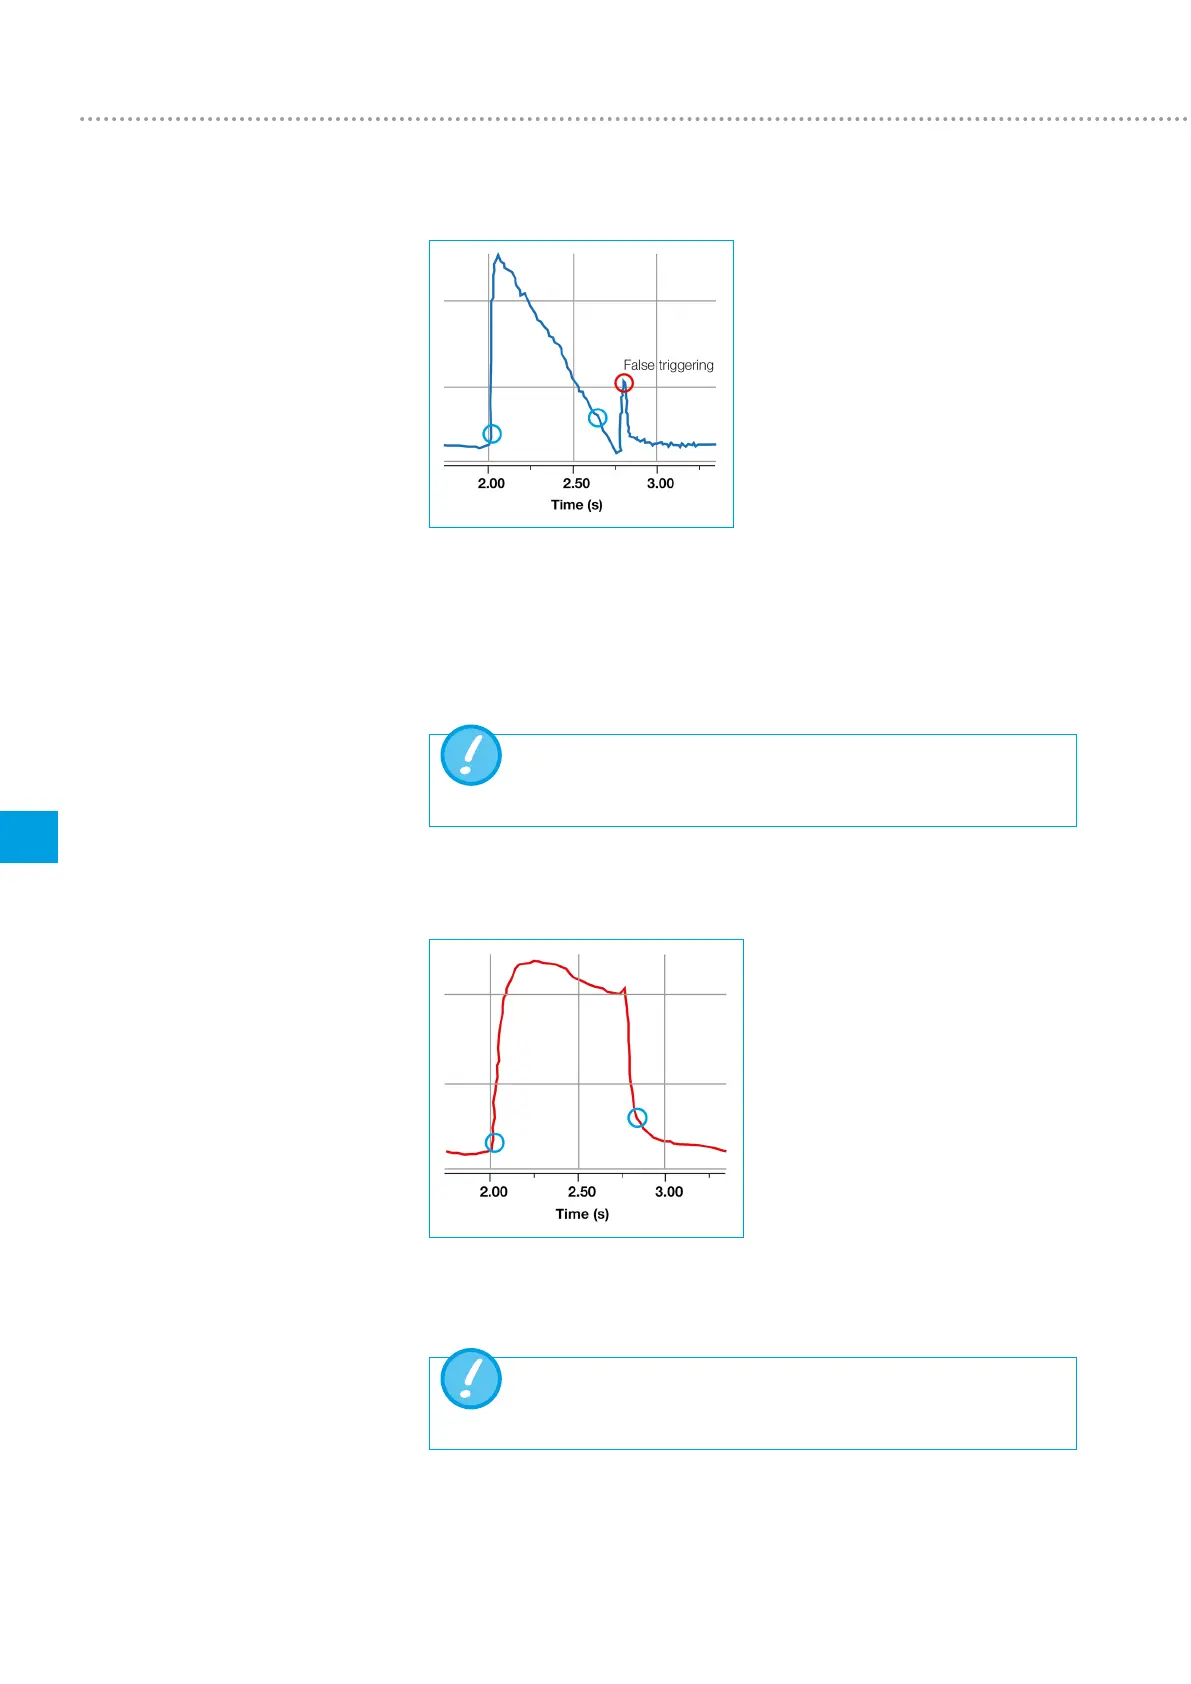
9.5.2 Flow curve upstream of the Y-piece
This graph shows the flow curve in the inspiratory channel upstream of the Y-piece.
The first two circles indicate the triggers that should be used in this case.
The illustration above shows that at this measuring point after inspiration, a small
false signal is still visible which was generated by switching over the valves. This leads
to false triggering!
Here, the flow must not be used as a trigger! The pressure curve
must be used instead (9.5.3 Pressure curve upstream of the Y-piece).
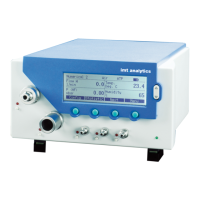
9.5.3 Pressure curve upstream of the Y-piece
Now here the standard triggers can again be used for the pressure curve:
(> 1 mbar / < 1 mbar).
Naturally, it is also important to ensure that the trigger is significantly
above the noise of the baseline. Otherwise, the trigger value must be
increased.
In the FlowLab software it is very easy to determine with the aid of the cursor where
the trigger should be placed.