Graphical User Interface
User’s Manual 22 Rev. 1.2, 2013-06-06
Software Description for Evaluation Kits
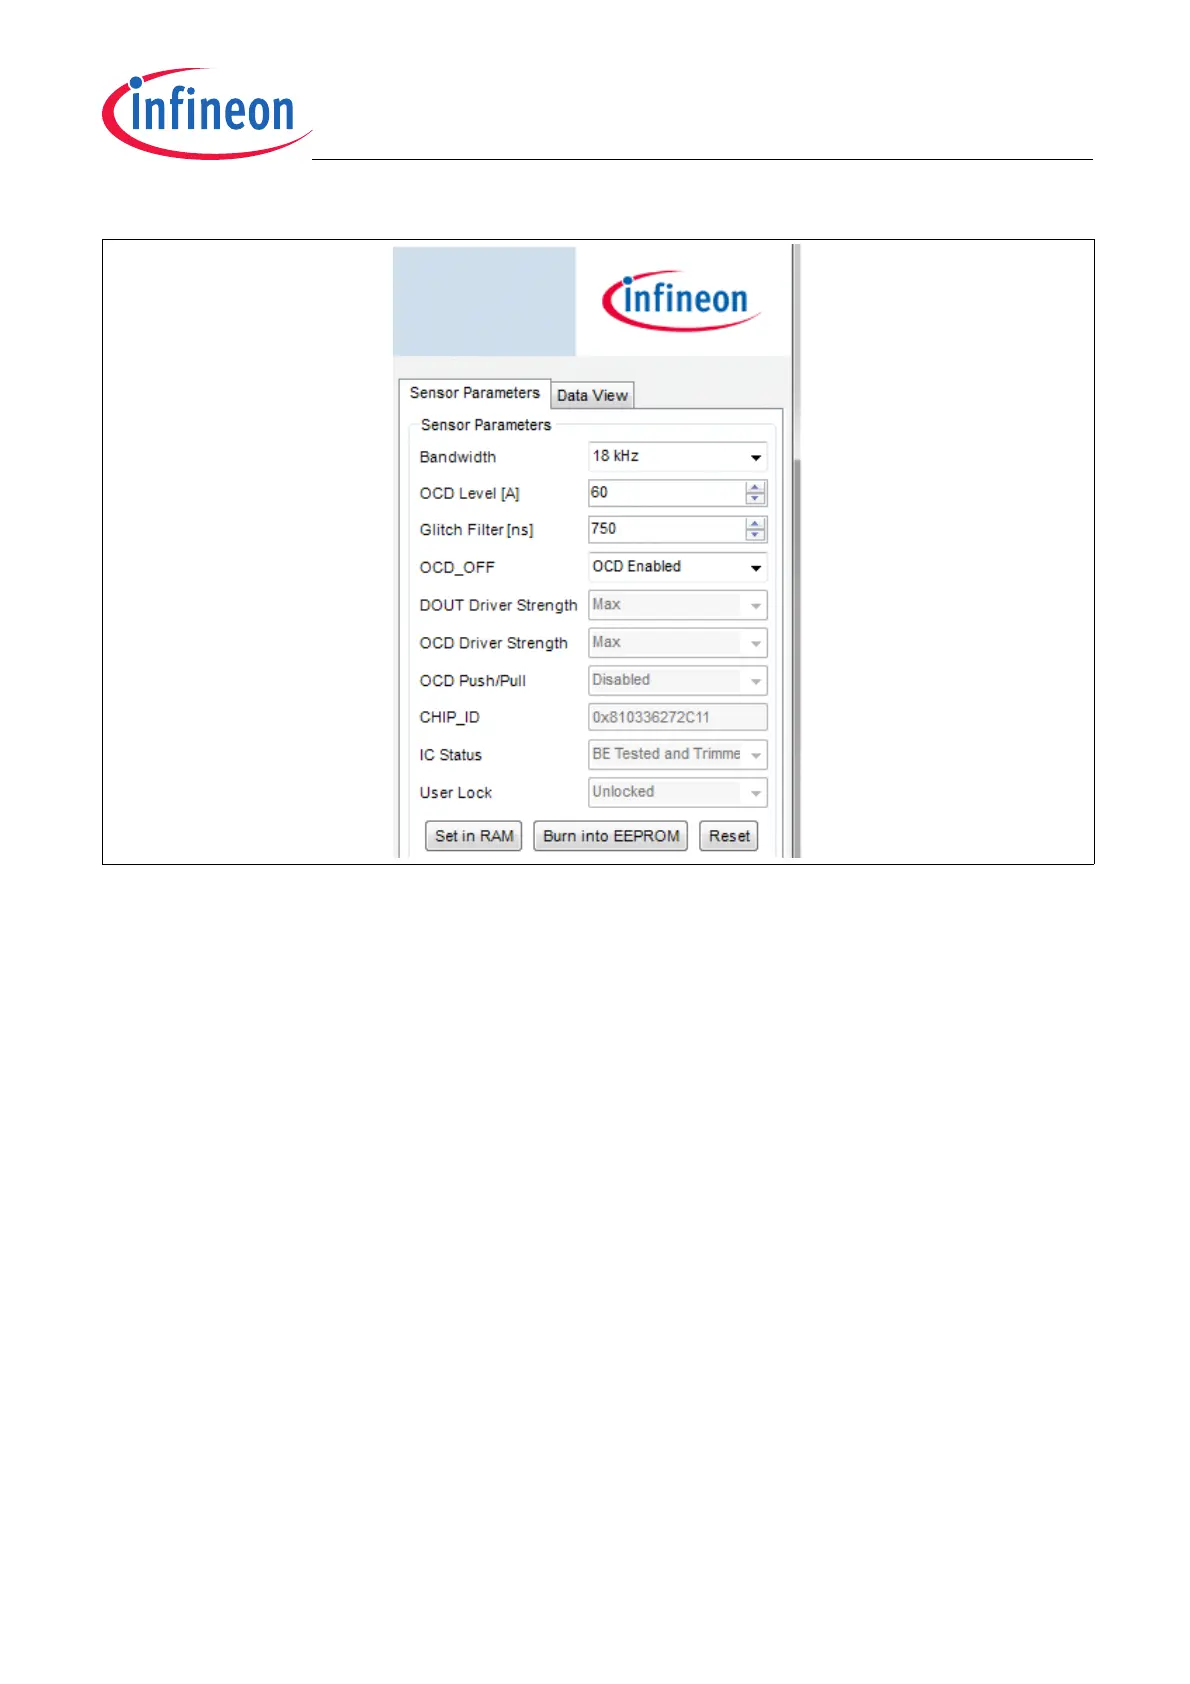
Figure 18 Sensor Parameters
4.2.2 Data View
The “Data View” window shows the last 1000 samples that are displayed on the graph. This view displays value
words as well as status words, see Figure 19:
• Index: The index corresponds to the sample index that has been sent from the programmer to the PC. The
PC compares the actual number of received samples with the sample number received from the programmer.
If one sample got lost during the communication, for example a buffer overflow, the “PGSISI 2 Error count” is
incremented.
• Current: This column shows the current in ampere.
• Parity OK: This column shows if the parity of one sample is “OK” or ”wrong”.
• OCD active: This column shows if an overcurrent has been detected or not. Therefore bit number 13 of the
SPI frame is evaluated.
• SPI data: This column shows the raw SPI data that has been received from the sensor.
The data view only shows a history of the previous 1000 samples. Whereas all samples during one measurement
are stored in a text file, as previously mention in Chapter 4.1. Please press the “Save” button to store the
monitored samples in a user-defined text file.
Note: The file size depends on the sample rate. The maximum growth rate is around 2MByte per second. After a
couple of minutes the file size can be up to 1GByte or even higher. To store such huge files may take several
minutes.
 Loading...