38
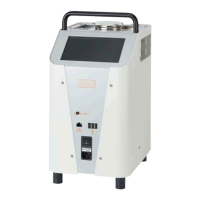
| Kaye LTR-150 - Dry Block & Liquid Bath All-in-One Temperature Calibrator
* To see live display of current reference value against target test point, touch and slide the
right arrow icon from its left side location to far right-side location of the Display Live
Graph field.
* The Live Graph screen appears, displaying current reference value (RV in blue) and target
test point (SP in red) along with current elapsed time of test.
* User can zoom in or out the graph by tapping on the plus or minus icons.
* User can also scroll back to the start of test to view the historical trend by tapping
down
and sliding the grey box immediately to the left of the Auto Scale box. To
return to current
time and temperature, simply release hold of the grey box.
* Tap on the X icon in the upper right-hand corner to exit live trend.
Chapter 8. Starting Standalone Manual Calibration
 Loading...