10: Capturing and analyzing waveforms Model DMM7510 7½ Digit Multimeter
10-10 DMM7510-900-01 Rev. B / May 2015
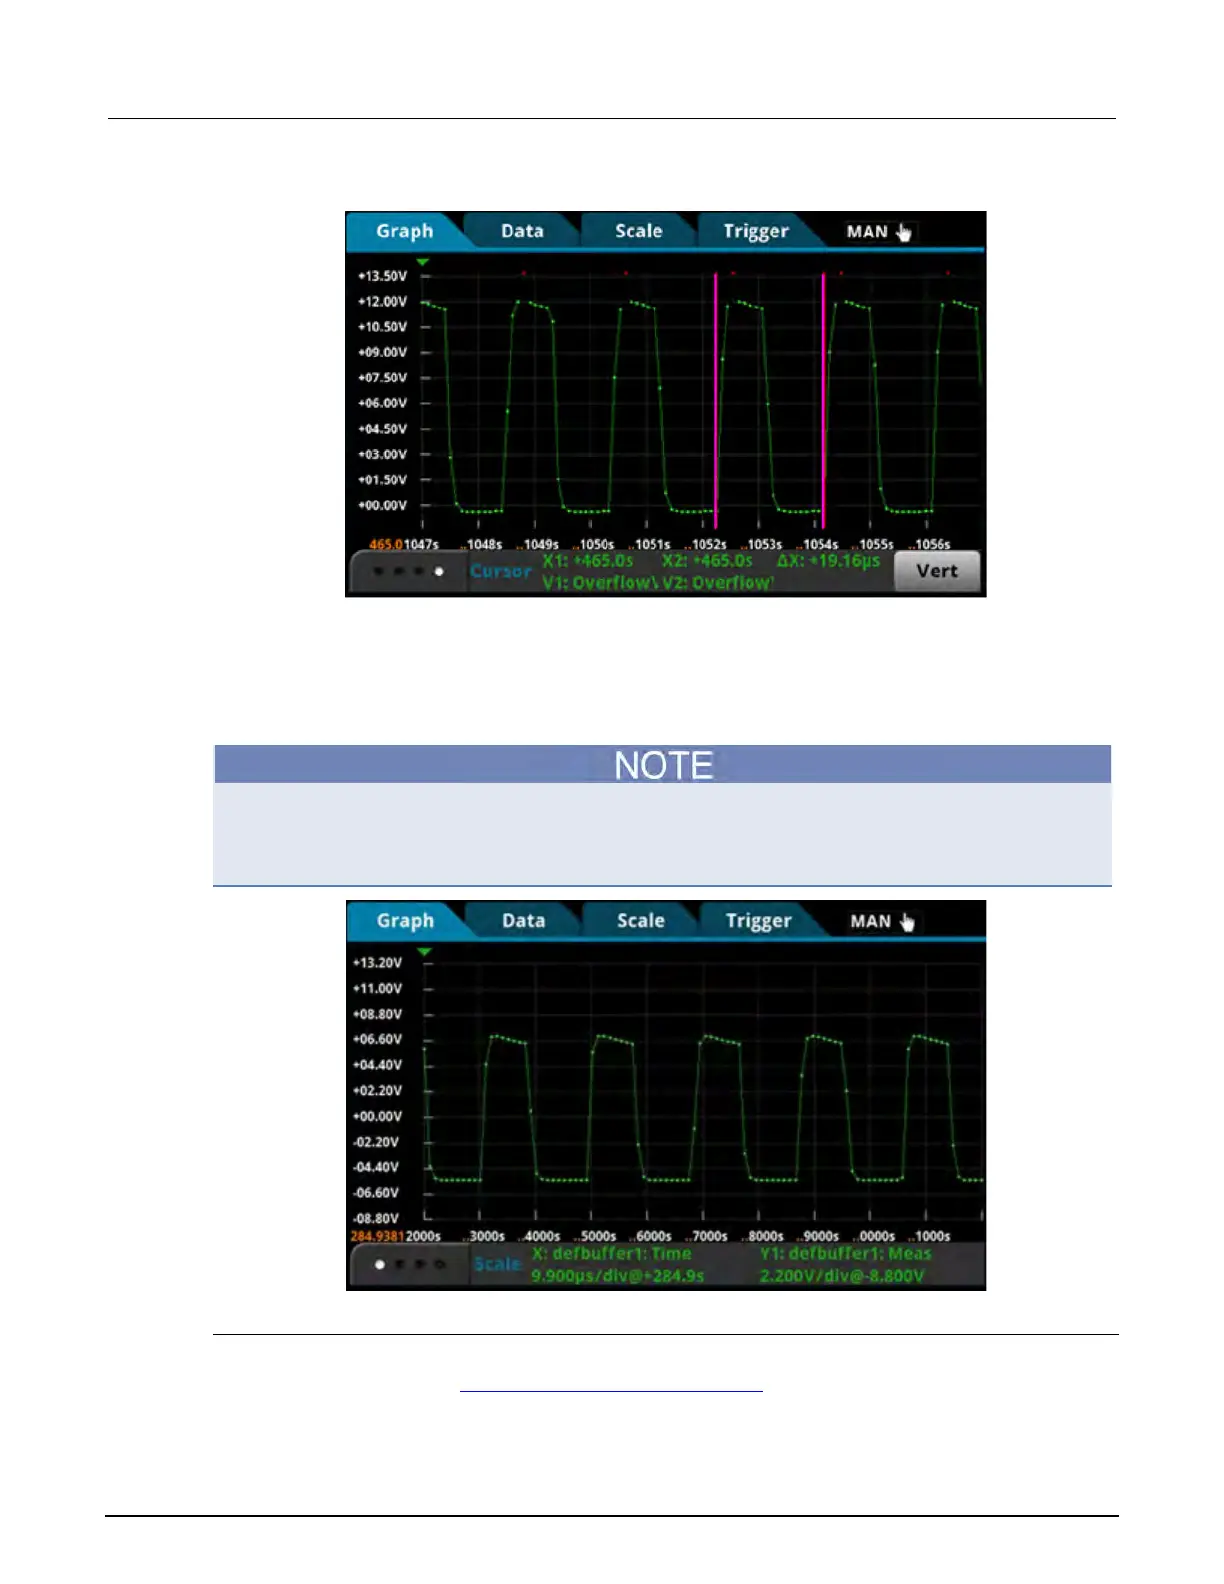
Figure 39: Duty cycle 3
• ∆high = 8.029 µs
• ∆period = 19.16 µs
• Duty cycle = 8.029 µs /19.16 µs = 40 %
• Expected output = duty cycle x input = 40 % x 12 V = 5 V
The red dots in the figures indicate an overflow condition, which occurs because the 12 V
measurement is over the 10 V measurement range. Instead of increasing the range to 100 V, which
reduces the analog bandwidth to 6 kHz, you can change the signal coupling to AC to maintain the
bandwidth integrity. Refer to the following screen capture of the AC coupled waveform.
Using SCPI or TSP commands
Use the command sequence for the ripple noise on the output voltage test to acquire the switching
voltage waveform. Refer to Ripple noise on the output voltage (on page 10-4).
北京海洋兴业科技股份有限公司(证券代码:839145)