3 Spectrum Analyzer Mode
3.7 Burst Power Measurement
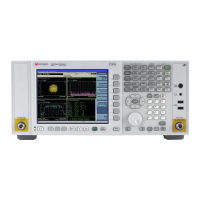
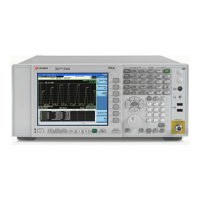
RF Envelope view
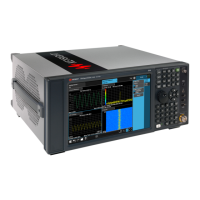
RF Envelope view with Bar Graph
The bar graph represents the measured portion of the trace. It is the blue bar in the
second figure. Its state (On/Off) is controlled by "Bar Graph On/Off" on page 1293
under Display.
RF Envelope window
Marker Operation Yes
Corresponding Trace Corrected measured trace (n=2,3,4)
Spectrum Analyzer Mode User's &Programmer's Reference 1239

 Loading...


