5.5 History Tab
A log of various optional parameters is maintained
within the PLM. Samples are taken every two minutes.
The last 120 samples (i.e the last 4 hours of operation)
may be viewed graphically on the History tab.
5.5.1 Curves
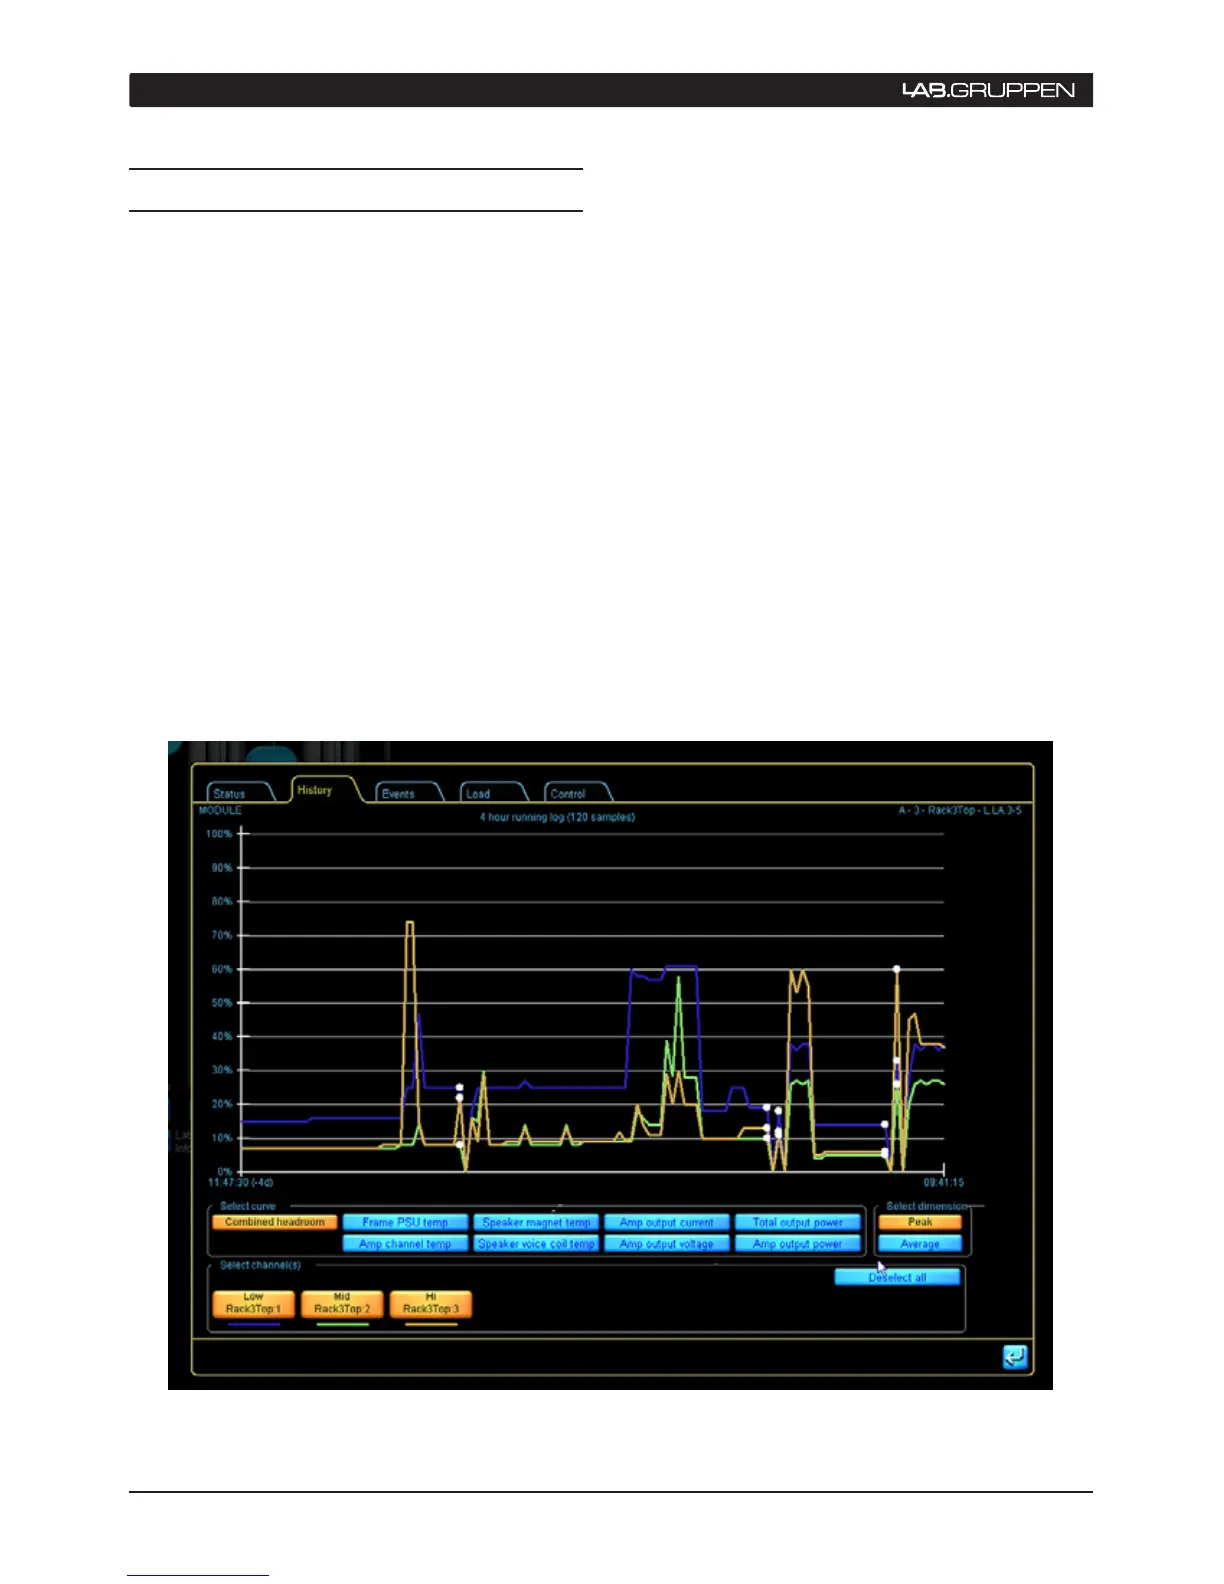
The History tab displays a graph of several PLM
operational parameters against time. The vertical
(Y-) axis is in arbitrary units and is scaled from 0 to
100%; the horizontal (X-) axis is effectively ‘time’,
but actually shows the previous 120 samples taken
at 2 minute intervals.
The parameter to be displayed is selected by tapping
on one of the buttons in the Select curve box below
the graph. The options are:
Combined Headroom
▸
– T his cu r ve i s c onstructe d
from all the individual parameters listed below,
and shows the maximum value from all of them
at each sample time.
Frame PSU temp
▸
– Shows the temperature
of the PLM PSU relative to its maximum safe
level.
Amp channel temp
▸
– Shows the temperature of
the PLM power output channel devices relative
to their maximum safe level.
Sp e a ke r magne t t e mp
▸
– Shows th e Speake r S afe
computed temperature of the loudspeaker
magnet/s for each channel.
Speaker voice coil temp
▸
– Shows the
SpeakerSafe computed temperature of the
loudspeaker voice coil for each channel.
Figure 5.5: History tab showing data in curve format
5 operation
 Loading...