52 cHAPTER 4: Operation
Model 335 Temperature Controller
The sensor reading of the instrument can always be displayed in sensor units. If a temper-
ature response curve is selected for an input, its readings may also be displayed in tem-
perature.
Once the input is configured (section 4.4), you may choose a temperature curve. Any
standard or user curve that matches the format of the sensor type configured for a
given input will be available under the Curve parameter in the Input Setup menu for
that input. You are also given the choice of None. When set to None, the front panel
readings configured for kelvin or Celsius will display the NOCURV message and the
interface will report 0 K and –273.15 °C for KRDG and CRDG queries, respectively.
Data points for standard curves are detailed in Appendix C.
Menu Navigation:
Input SetupQInput (A, or B) Q QCurve (Any curve of matching type)
Interface: INCRV
4.4.8 Filter
The reading filter applies exponential smoothing to the sensor input readings. If the
filter is turned on for a sensor input, all reading values for that input are filtered. The
filter is a running average so it does not change the update rate of an input. Filtered
readings are not used for control functions, but they are used for all input features
including Max/Min.
The number of filter points determines filter bandwidth. One filter point corresponds
to one new reading on that input. A larger number of points does more smoothing,
but also slows the instrument’s response to real changes in temperature. The default
number of filter points is eight, which settles to within six time constants of a step
change value in 45 readings, or 4.5 s.
The time constant (time it takes to settle to within 36.8% of the step value after a step
change) for a given number of filter points can be derived using the following formula:
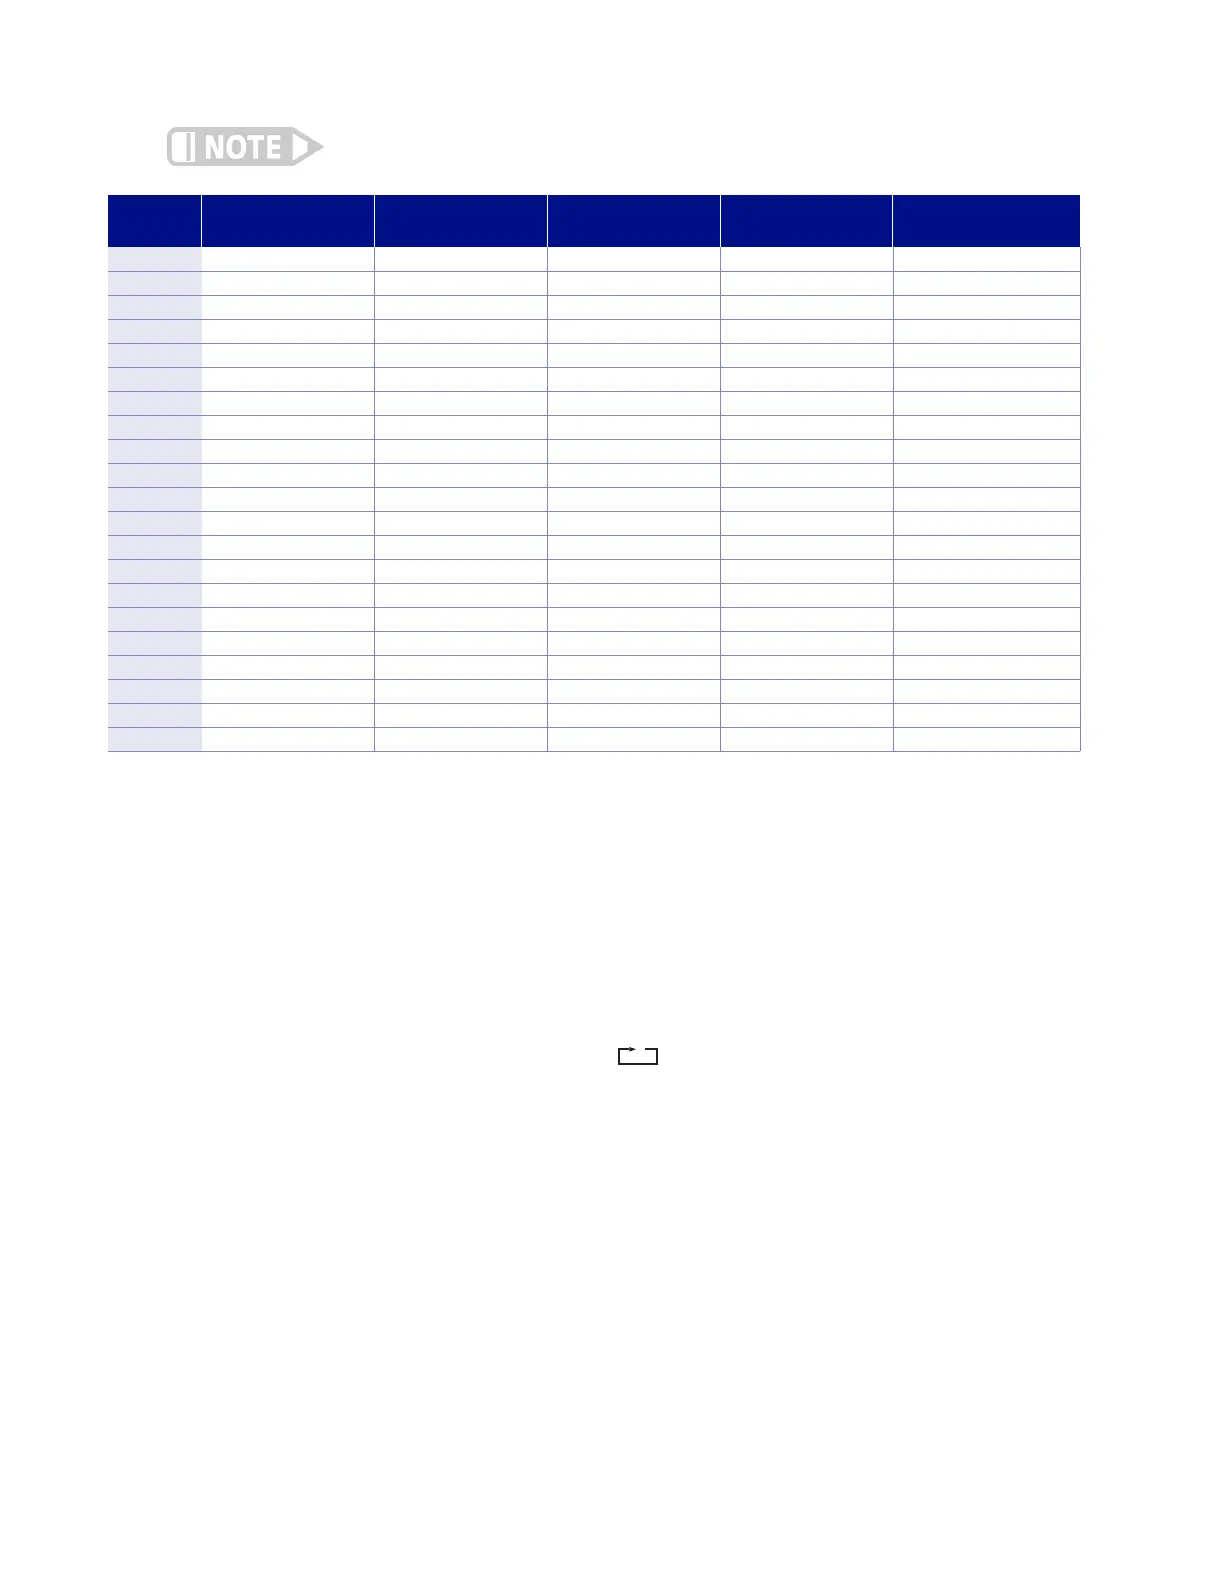
Curve
number
Curve name Sensor type Model number Temperature range** For data points, refer to:
01 DT-470 Diode DT-470 1.4 K to 475 K Tab le D-1
02 DT-670 Diode DT-670 1.4 K to 500 K Tab le D-2
03 DT-500-D* Diode DT-500-D 1.4 K to 365 K Tab le D-3
04 DT-500-E1* Diode DT-500-E1 1.1 K to 330 K Tab le D-3
05 Reserved — — — —
06 PT-100 PTC RTD PT-100 30 K to 800 K Tab le D-4
07 PT-1000* PTC RTD PT-1000 30 K to 800 K Tab le D-4
08 RX-102A-AA NTC RTD Rox RX-102A 0.05 K to 40 K Tab le D-5
09 RX-202A-AA NTC RTD Rox RX-202A 0.05 K to 40 K Tab le D-6
10 Reserved — — — —
11 Reserved — — — —
12 Type K Thermocouple Type K 3 K to 1645 K Tab le D-7
13 Type E Thermocouple Type E 3 K to 1274 K Table D-8
14 Type T Thermocouple Type T 3 K to 670 K Tab le D-9
15 AuFe 0.03%* Thermocouple AuFe 0.03%* 3.5 K to 500 K Table D-10
16 AuFe 0.07% Thermocouple AuFe 0.07% 3.15 K to 610 K Table D-11
17 Reserved — — — —
18 Reserved — — — —
19 Reserved — — — —
20 Reserved — — — —
21 to 59 User curves — — — —
* No longer offered by Lake Shore
**Instrument may not support the sensor over its entire range
TABLE 4-8 Sensor curves